Quantitative tracks
BigWig and BedGraph files store genome-wide quantitative signals — read depth, ChIP-seq enrichment, conservation scores, and more. JBrowse renders them as continuous tracks with several visual styles.
Renderer types
Switch renderer via Track menu → Renderer type:
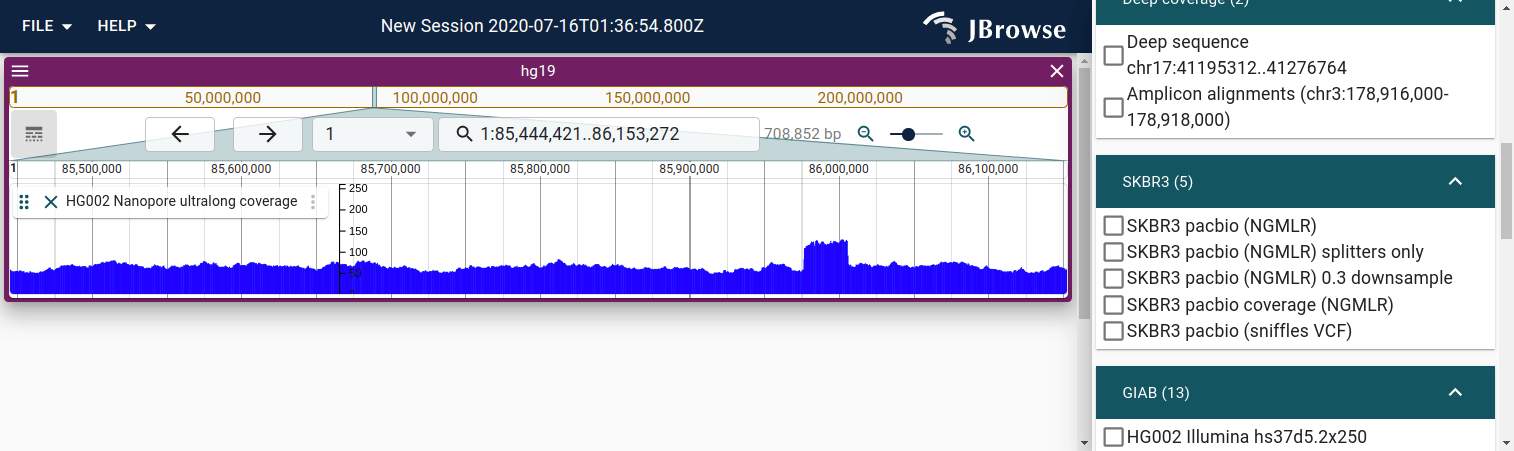
- XY plot (default) — filled bar chart; good for coverage and discrete peaks
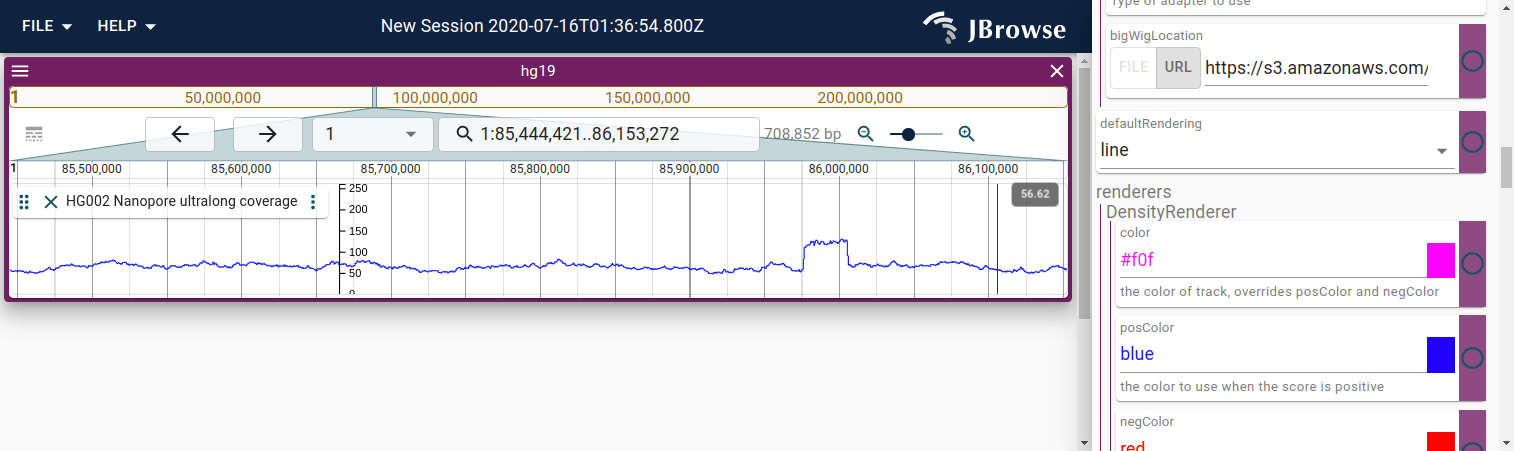
- Line — connects data points with a line; better for smooth signals and fine resolution comparisons
Autoscale options
Track menu → Autoscale type controls the Y-axis range:
- Global min–max — scales to the full range of values in the file (good for consistent comparison across sessions)
- Local min–max — rescales to the current view (useful when navigating to regions with very different signal levels)
- Local +/− 3SD — scales to three standard deviations of the local signal, clipping outlier spikes; recommended for coverage tracks that have a few anomalously high positions
Other track options
- Track menu → Set log scale — log-transforms the Y axis; useful when signal spans several orders of magnitude
- Track menu → Fill mode — toggles between filled bars and outline-only
- Track menu → Resolution — manually increase or decrease the data resolution; JBrowse auto-selects resolution based on view width but you can override it
- Track menu → Set min/max score — pin the Y axis to specific values for side-by-side comparison across samples
Viewing whole-genome coverage for CNV profiling
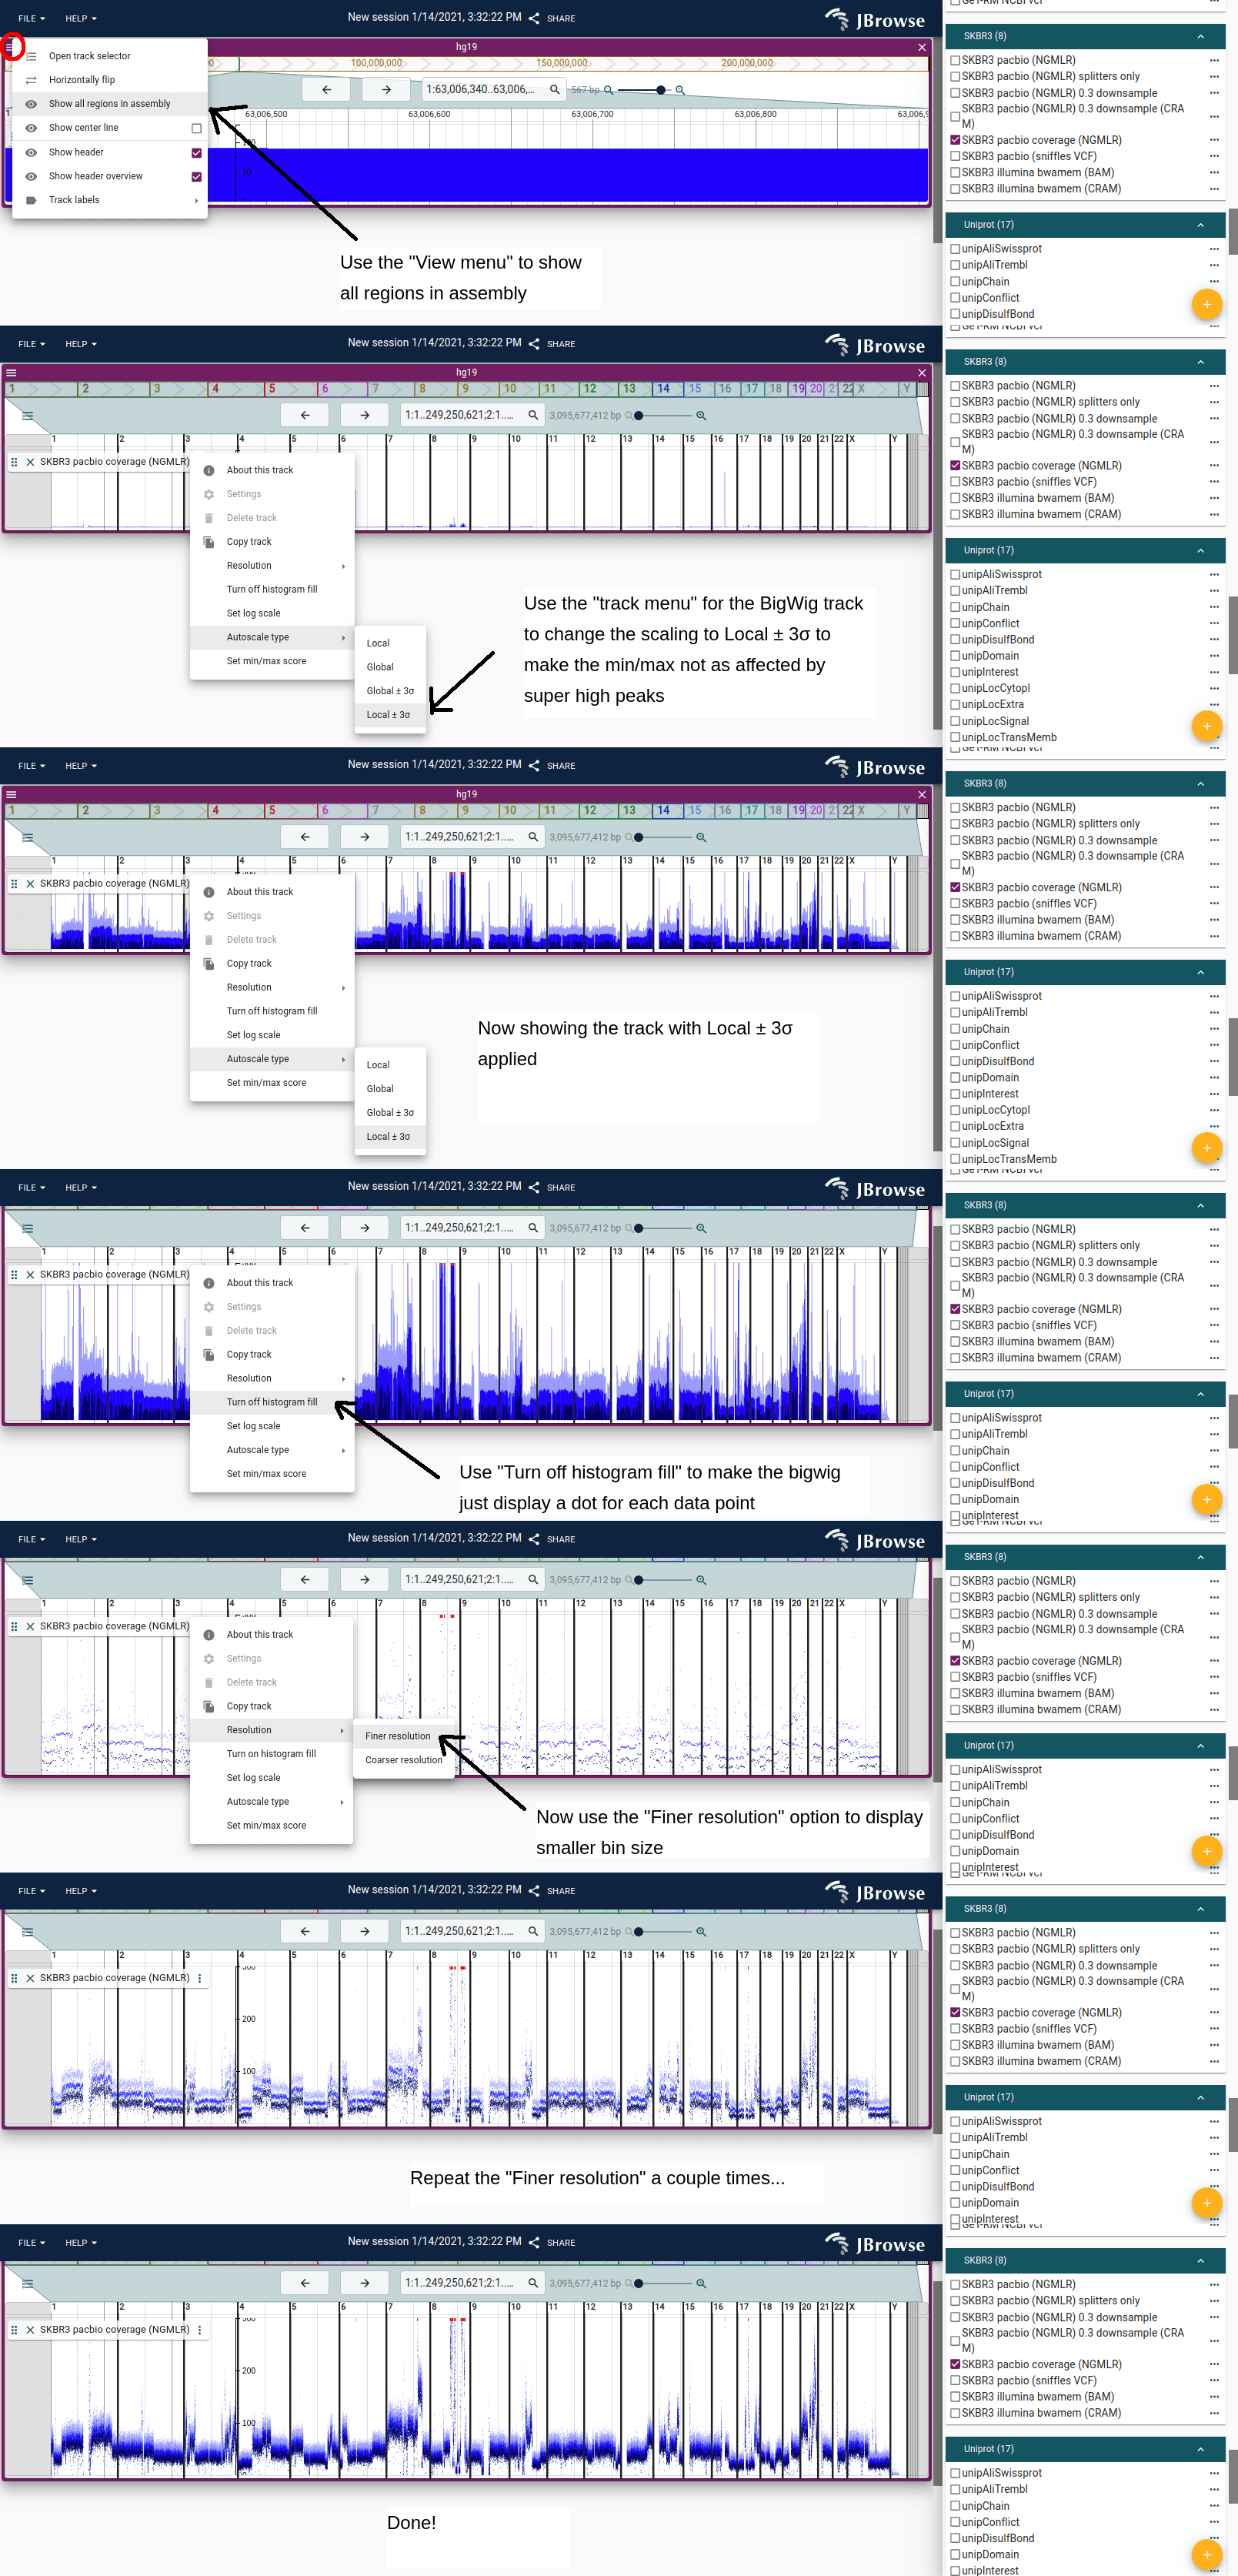
To get a chromosome-scale view of copy-number changes:
- Open your BigWig track
- View menu → Show all assembly regions
- Track menu → Autoscale type → Local +/- 3SD (clips outlier spikes)
- Track menu → Turn off histogram fill (shows individual data points more clearly at small scale)
- Track menu → Resolution → Finer resolution a few times until the profile looks smooth
Drag the bottom edge of the track down to make it taller.
For tumor vs normal comparisons using two BigWig tracks on the same Y-axis, see Multi-quantitative tracks.