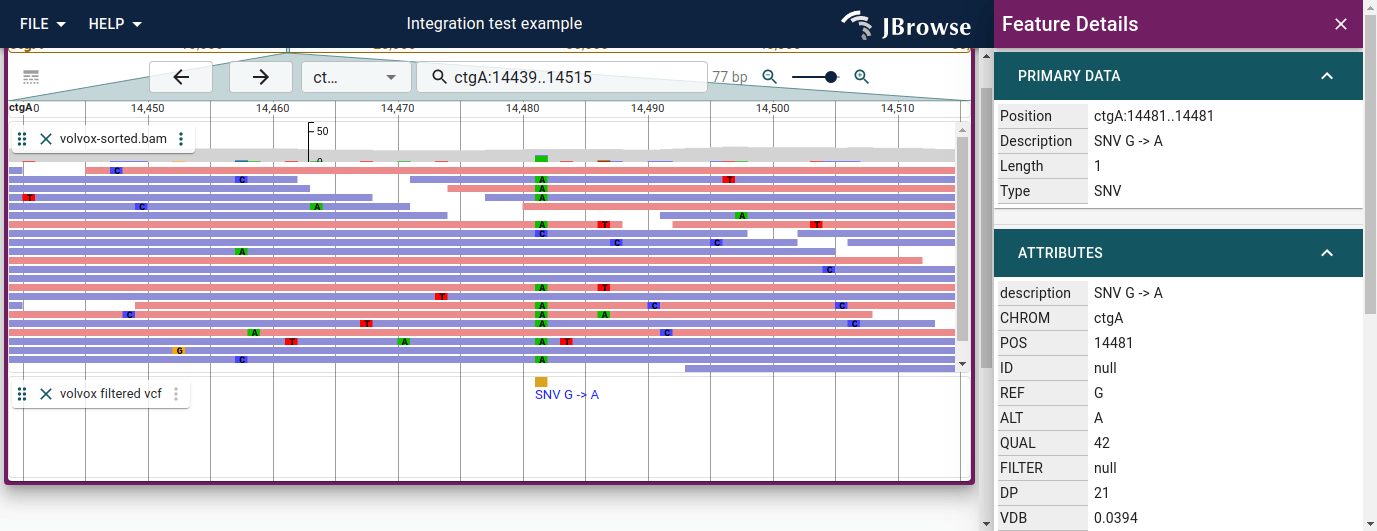
Clicking a variant opens a widget with a per-sample genotype table. Multi-sample
VCFs (like 1000 Genomes) can contain thousands of samples.
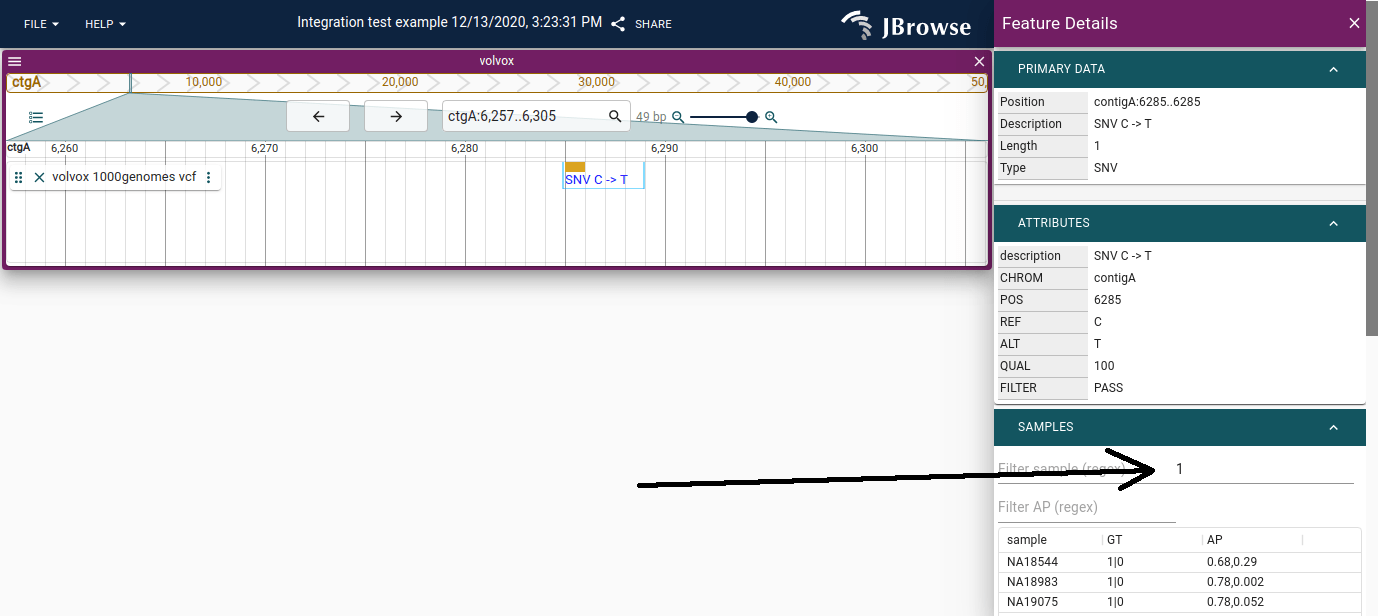
Feature details panel for an SNV (C→T). The SAMPLES section lists every sample with its genotype (GT) and other per-sample fields. The 'Filter sample (regex)' field at the top of the SAMPLES section accepts a regex; typing '1' keeps only samples with the alt allele (1|0 or 0|1), hiding the many homozygous-reference rows.
The matrix display shows multi-sample VCFs as a dense heatmap where each row is
a sample and each column is a variant position. This makes genotype patterns —
shared variants, population structure, runs of homozygosity — visible at a
glance in ways that a per-position track cannot.
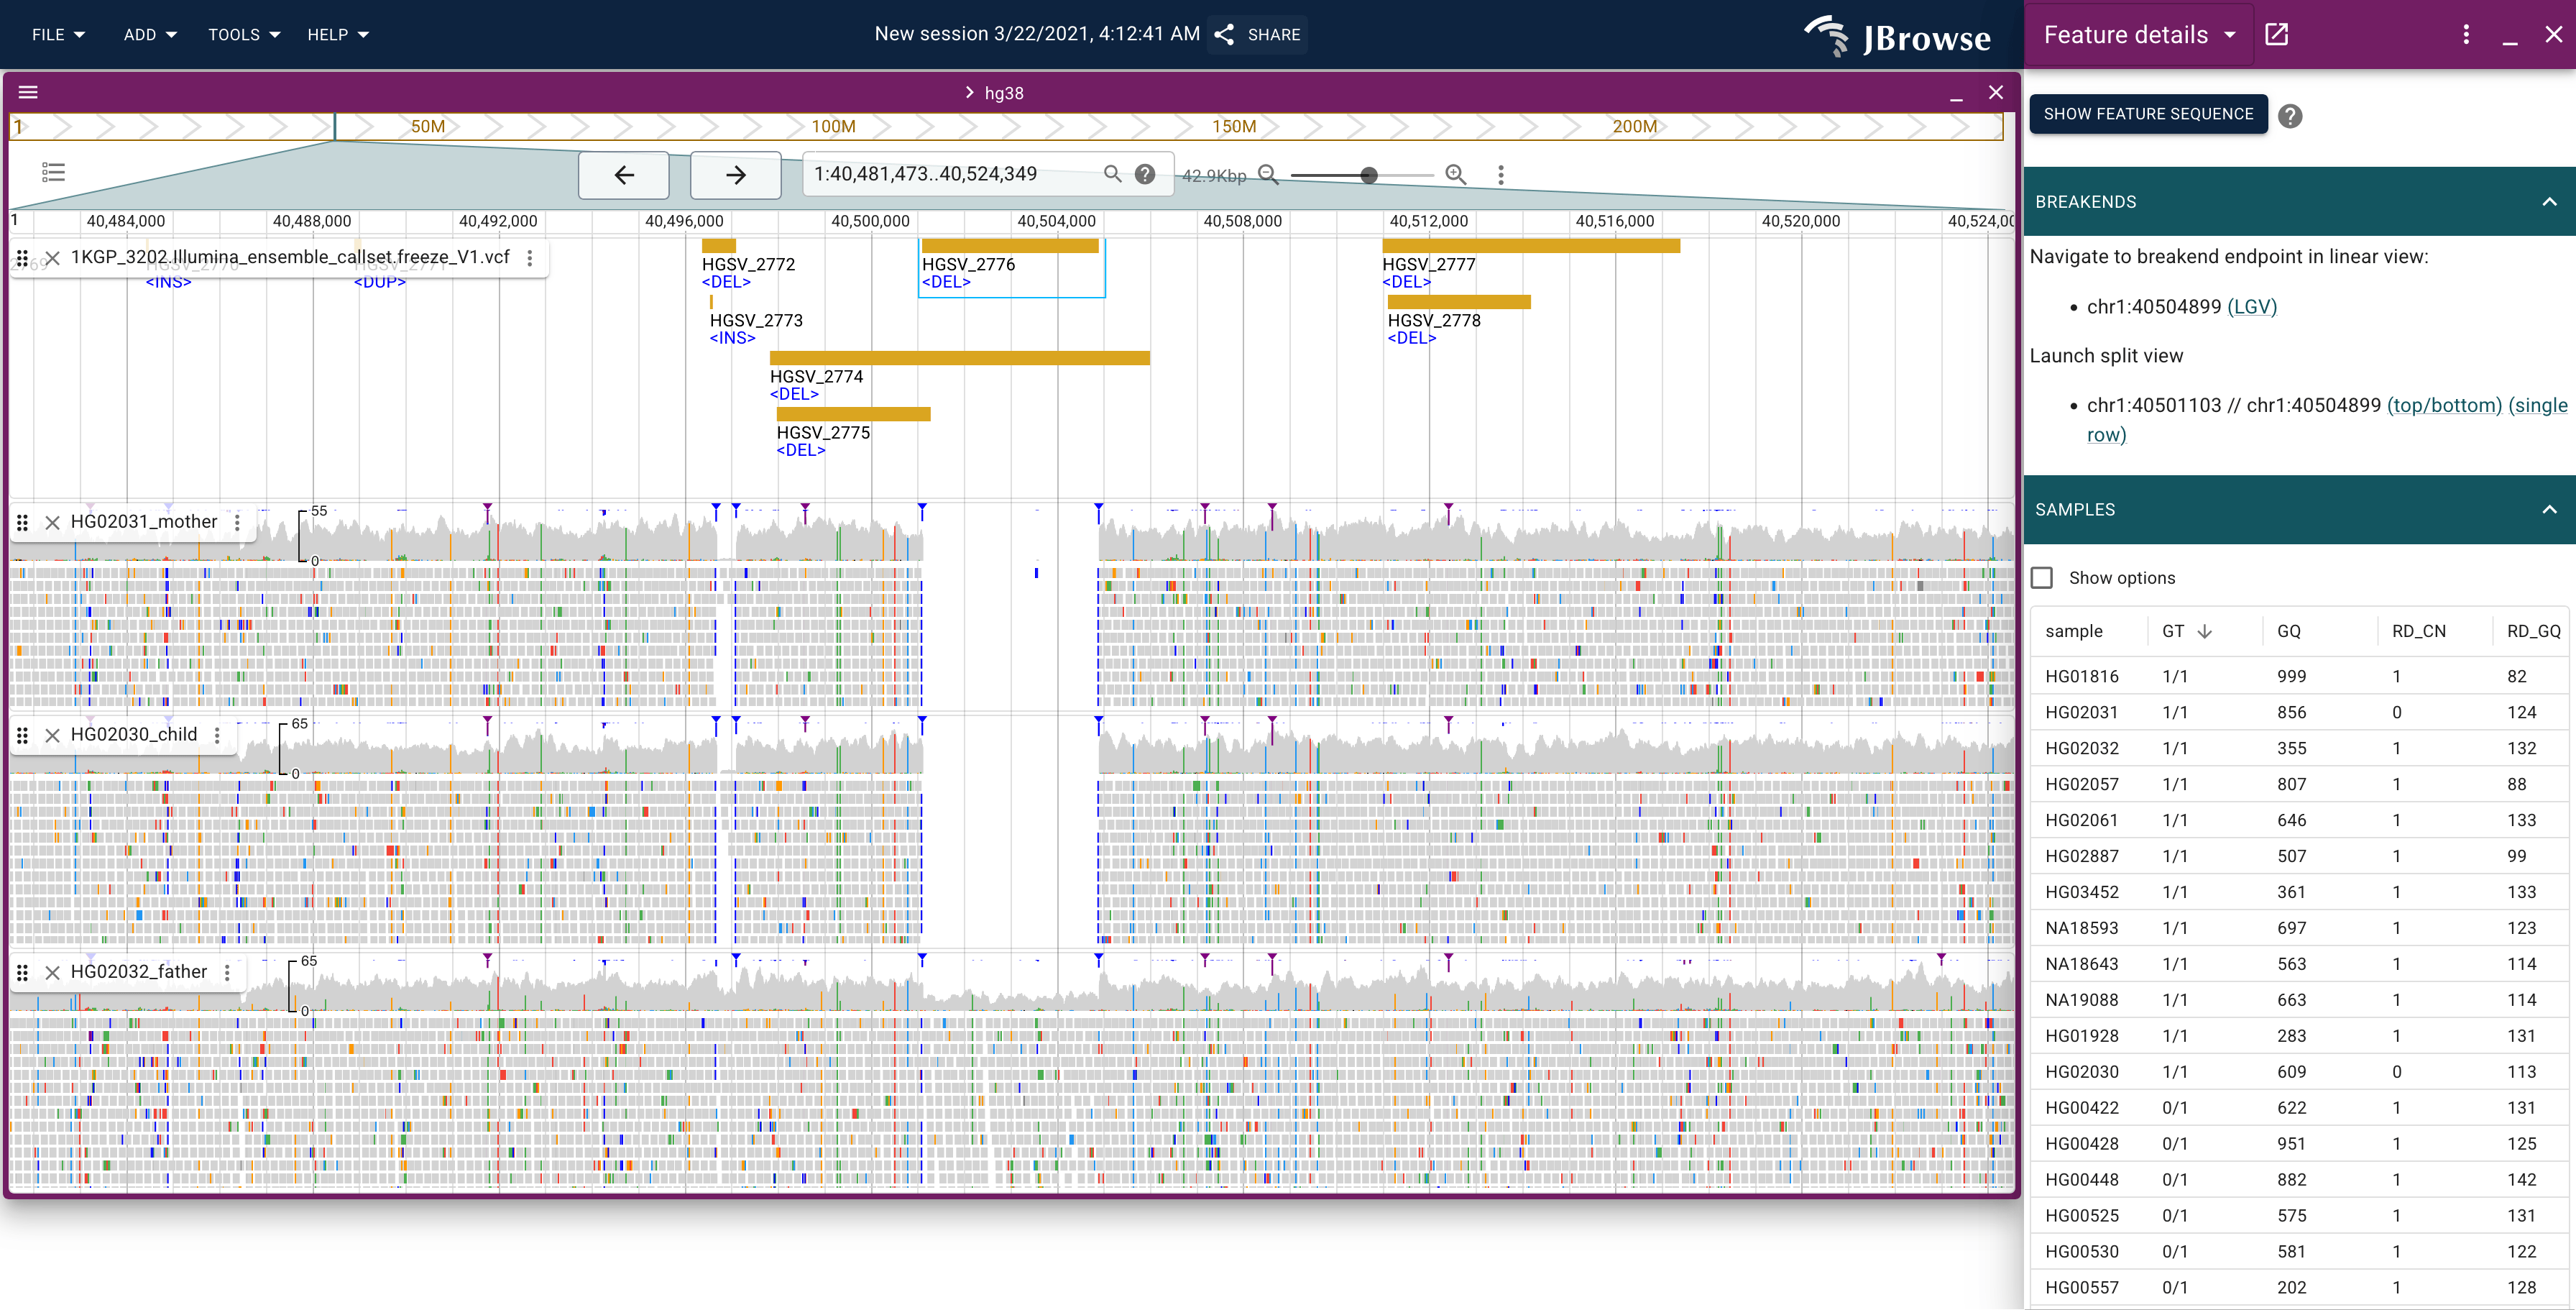
Example screenshot of looking at a deletion structural variant, with alignment evidence from a mom, dad, and child (trio). The first two samples (mother, child) have complete (homozygous) deletion in this region, while the father has a heterozygous deletion. The blue markers show 'soft clipping' at the boundaries of the deletion. The right panel shows all the samples, sorted by their genotype