The dotplot view is a 2D comparative view that displays alignments between
genome assemblies, or between a single read and the genome. Syntenic regions
appear as diagonal lines or blocks; inversions appear as reverse-diagonal
segments; translocations and rearrangements appear as off-diagonal blocks.
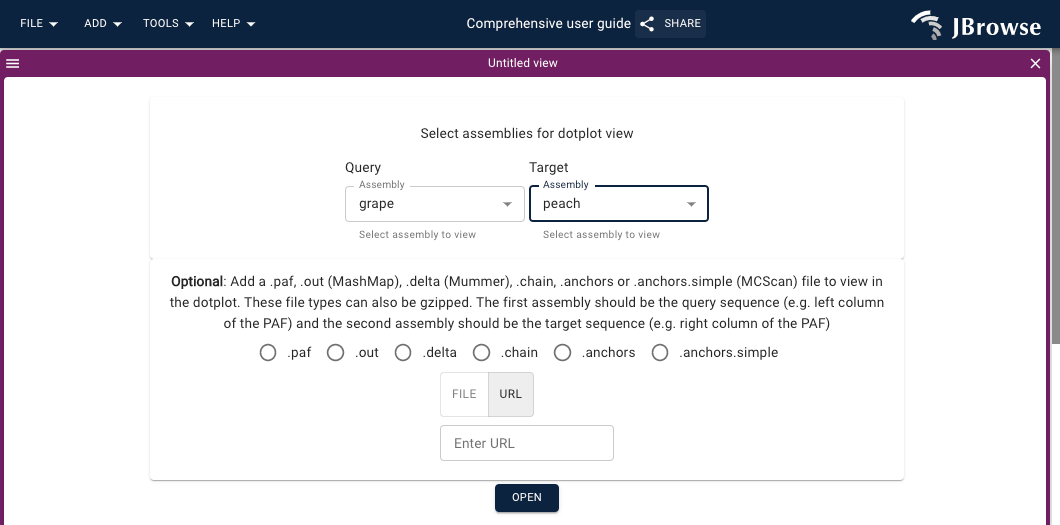
Optionally, add a .paf, .out (MashMap), .delta (Mummer), .chain, .anchors or
.anchors.simple (MCScan) file
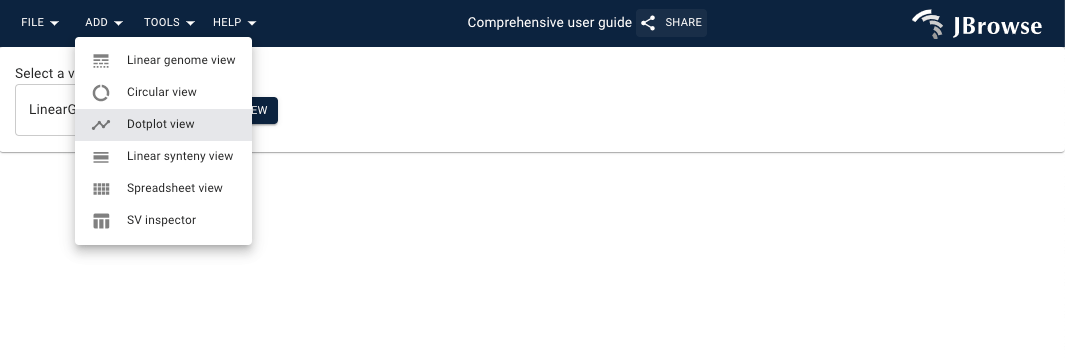
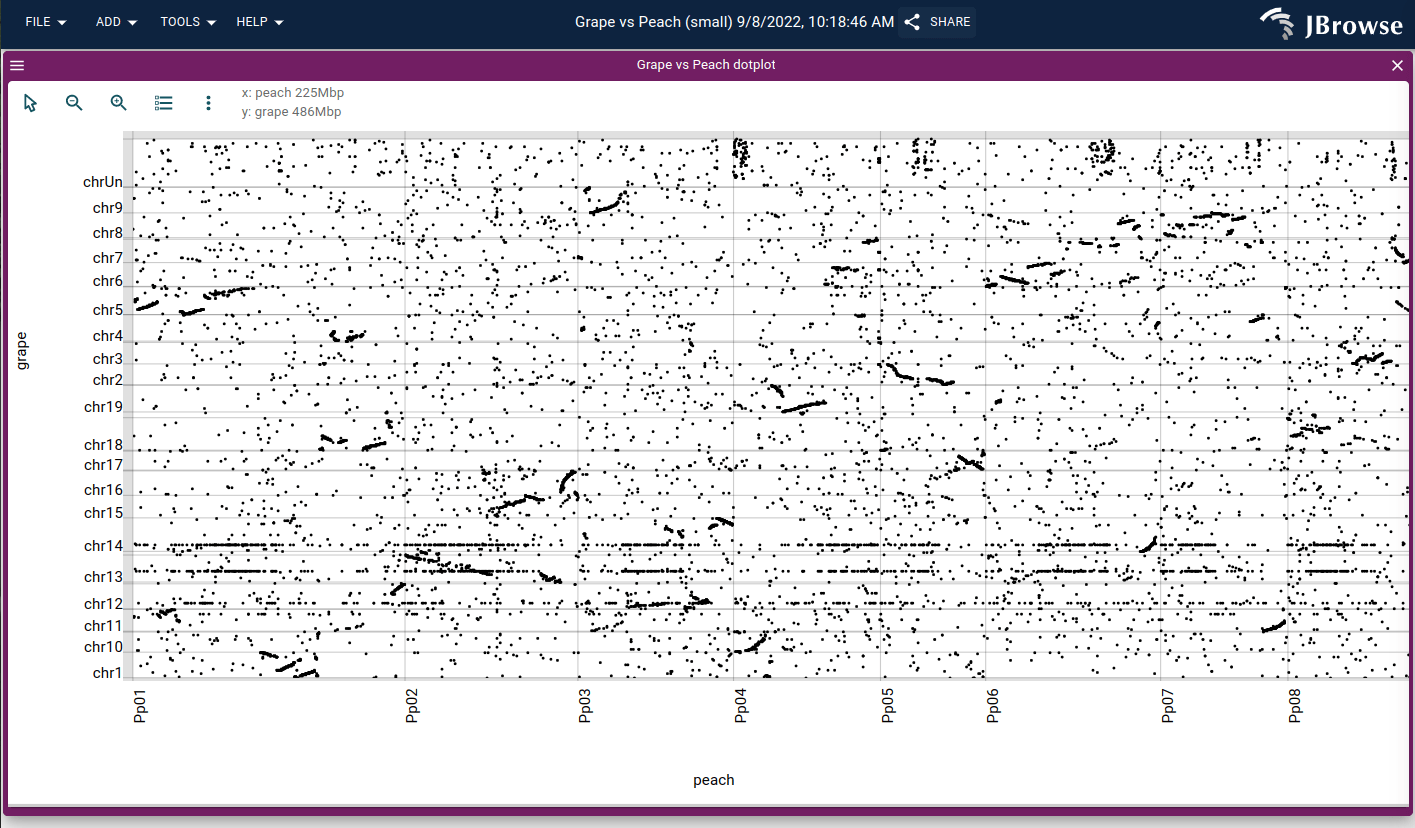
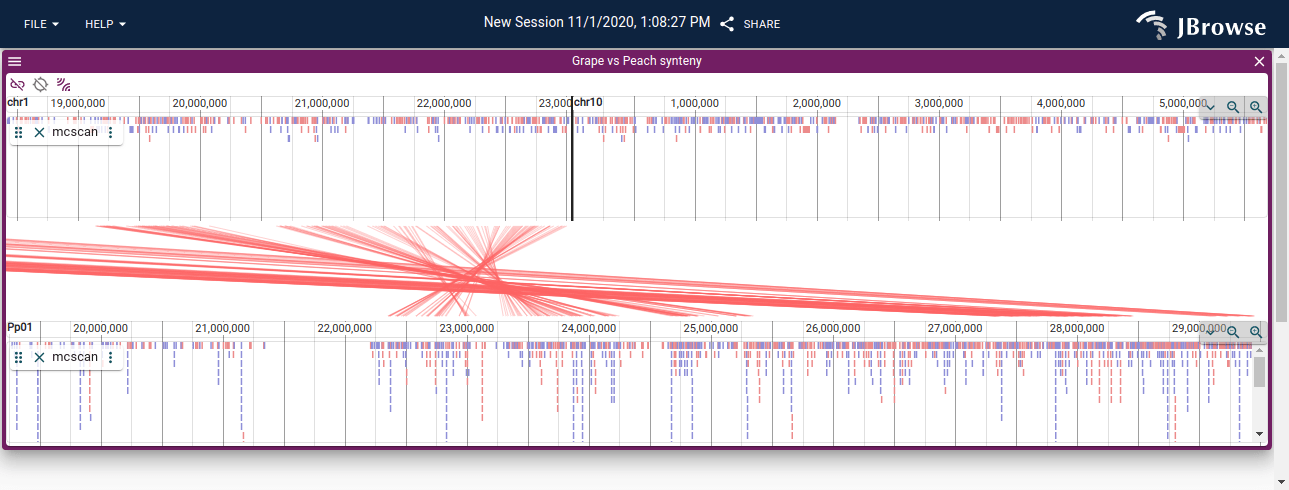
Adding a new dotplot or synteny view via the menubar.Screenshot of the import form for a dotplot or synteny view. You can select two different assemblies and an additional file can be supplied.Dotplot of grape (Y-axis) vs peach (X-axis) genomes. Diagonal streaks are syntenic blocks where the two genomes are collinear. Off-diagonal blocks indicate chromosomal rearrangements; reverse-diagonal segments indicate inversions.Linear synteny view of the grape vs peach genome generated from the same PAF file as the dotplot. Colored ribbons connect collinear blocks between the two assemblies — red ribbons are forward-strand alignments, blue are inverted. The alignment depth and extent of synteny are clearer at this scale than in the dotplot.
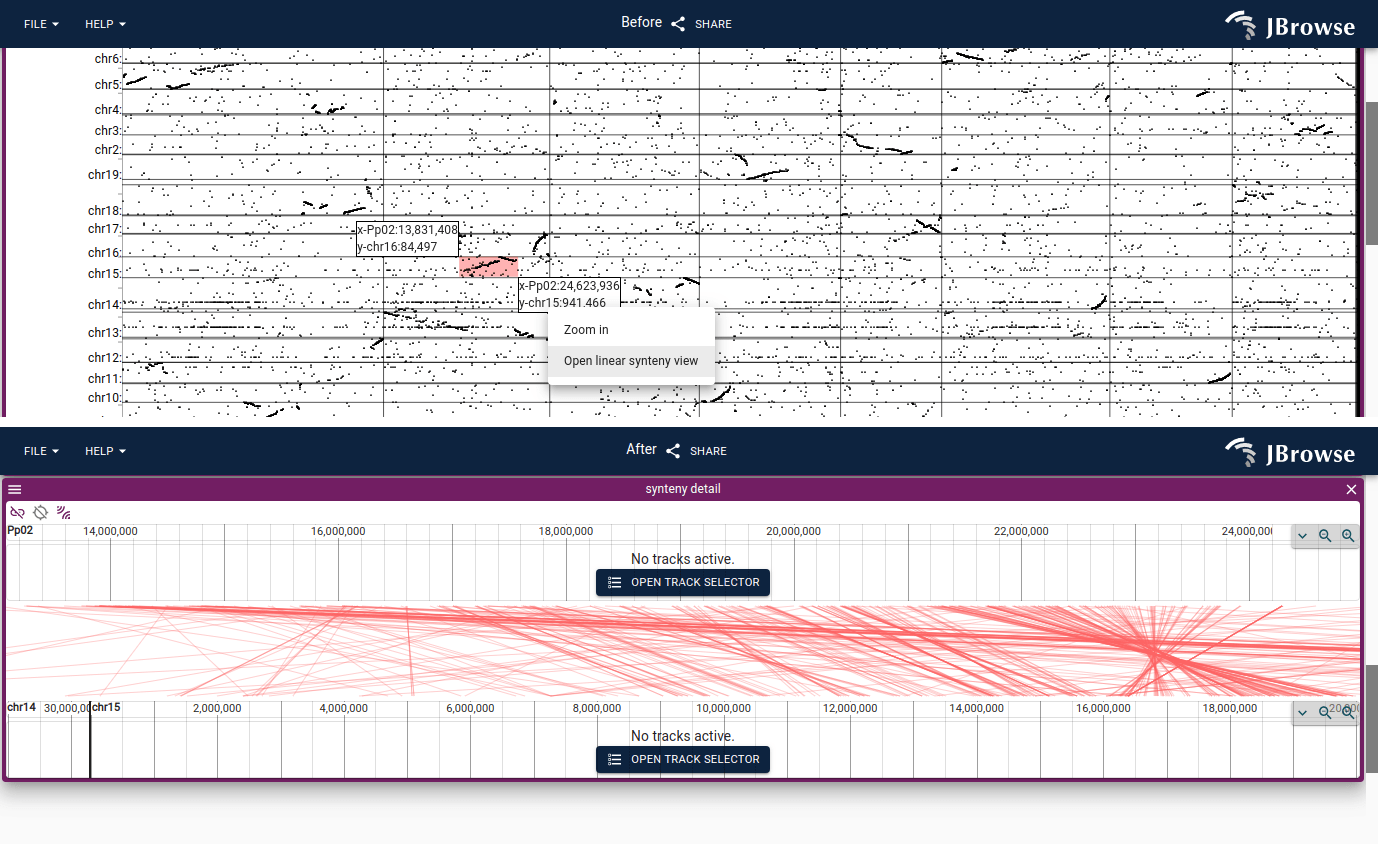
Click and drag to select a region in the dotplot, then choose Open linear
synteny view from the context menu. This zooms into that region in a new
linear synteny view with both genomes shown as tracks.
Top: click-and-drag selection (pink highlight) on the grape vs peach dotplot, with the context menu showing 'Zoom in' and 'Open linear synteny view'. Bottom: the resulting linear synteny view for the selected region (Pp02 vs chr15), with red connection lines linking each syntenic alignment block across the two genome panels.
For a step-by-step walkthrough of loading assemblies, generating a PAF with
minimap2, and using the dotplot and linear synteny views together, see the
Synteny and genome alignment tutorial.