Synteny visualization and genome alignment
This tutorial covers the dotplot view (chromosome-scale alignment overview) and linear synteny view (base-level inspection) using whole-genome alignment data.
For general background on synteny views and a worked example with tumor and normal genome comparison, see the SV visualization guide.
What you need
This tutorial assumes you already have a JBrowse 2 instance running (see the web quickstart for setup). You will need:
- Two genome assemblies in FASTA format (or use public assemblies)
- A whole-genome alignment (PAF, MUMmer
.delta, or UCSC.chain) - The jbrowse CLI to add the alignment to your config
To generate a PAF alignment, install minimap2:
minimap2 -x asm5 reference.fa query.fa > alignment.paf
The -x asm5 preset is for whole-genome assembly comparison. You can also use
MUMmer and convert the .delta output to PAF
with delta2paf from
paftools.js, or
convert UCSC chain files with chain2paf from the same toolkit. For small files
you can load .delta or .chain directly into JBrowse without converting.
Loading assemblies and alignments
Both genomes must be loaded as assemblies before adding the alignment:
jbrowse add-assembly reference.fa --out $OUT --load copy
jbrowse add-assembly query.fa --out $OUT --load copy
Add the PAF as a synteny track. The assembly names in -a must match what you
passed to add-assembly:
jbrowse add-track alignment.paf -a query,reference --out $OUT --load copy
Important: Assembly order in -a must match minimap2 argument order:
minimap2 reference.fa query.fa → add-track -a query,reference.
Dotplot view
The dotplot view renders a pairwise sequence alignment as a 2D scatter plot, with one genome on each axis and aligned regions shown as diagonal lines (or off-diagonal if there are rearrangements).
Launching the dotplot
From the main JBrowse start screen, click Dotplot, select two assemblies (one per axis), and pick the synteny track.
Reading the dotplot
- Diagonal lines (slope ≈ 1) represent collinear aligned regions.
- Off-diagonal lines indicate rearrangements: inversions, translocations, or duplications.
- Scattered points represent short local alignments or repetitive regions.
- Gaps suggest missing or misaligned sequence.
Launching a linear synteny view from the dotplot
To inspect a region, click and drag over it in the dotplot, then click Launch synteny view.
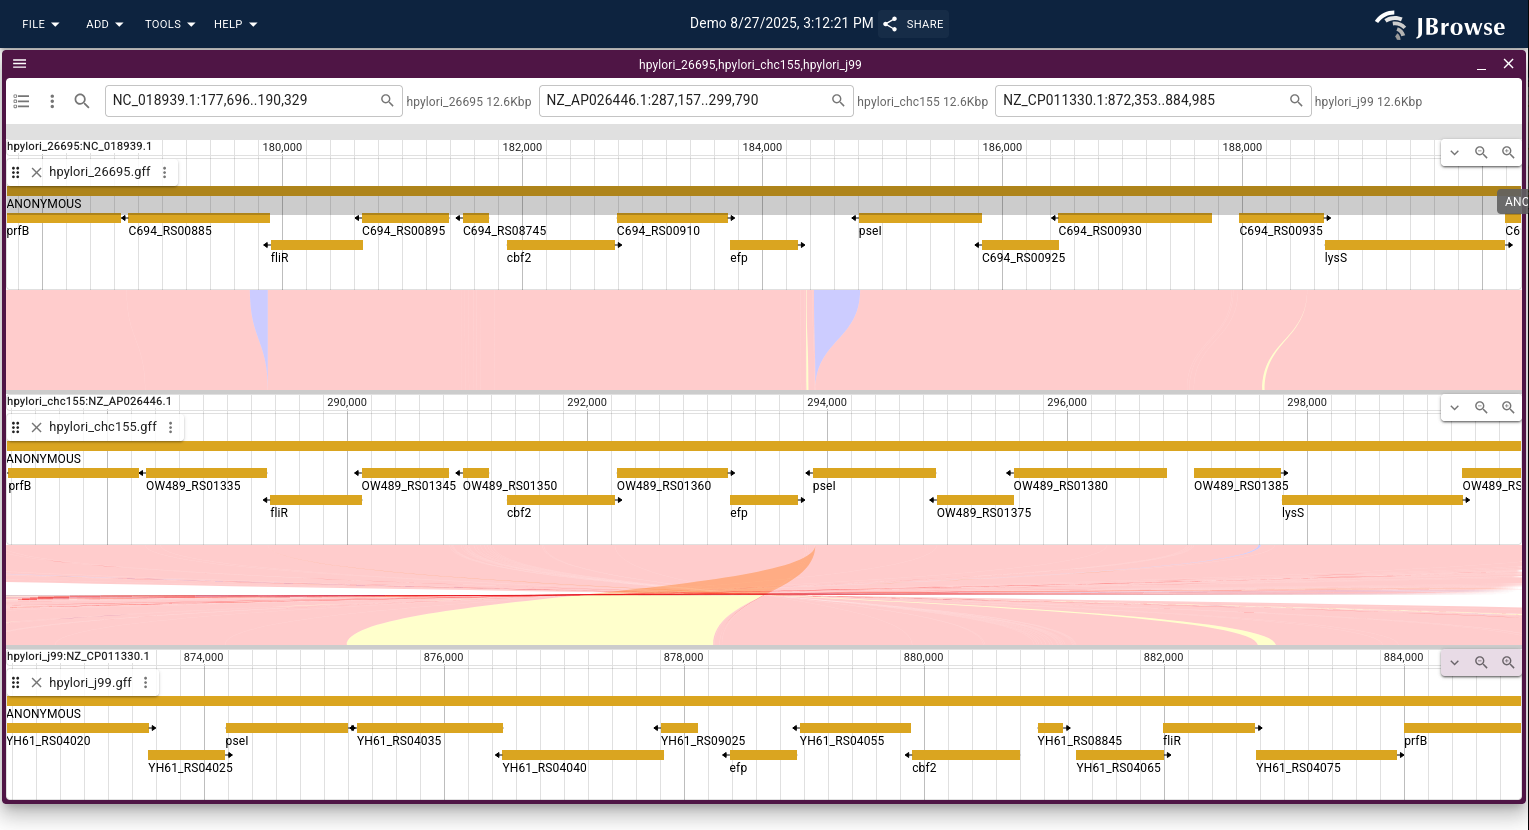
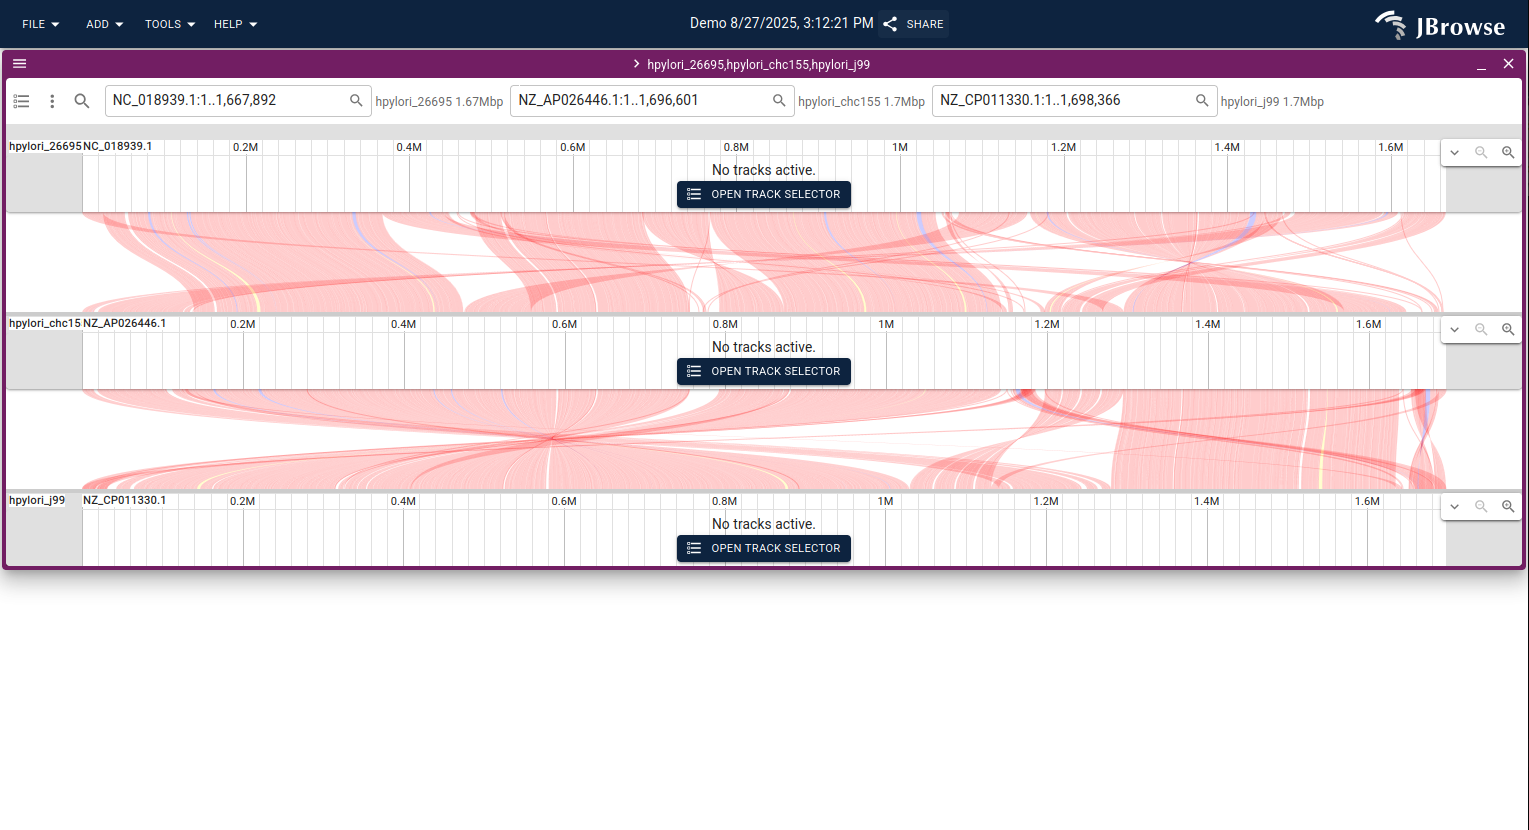
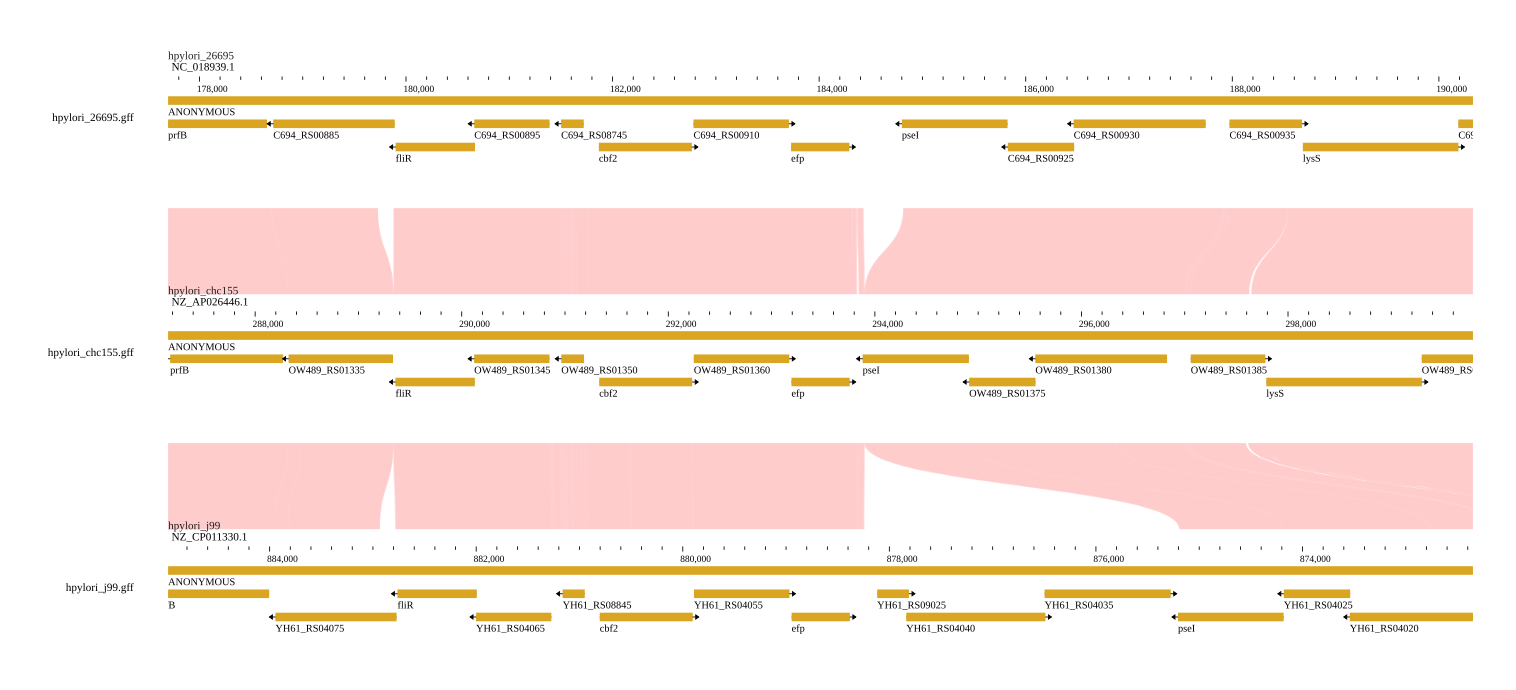
Linear synteny view
The linear synteny view shows two genomic regions side-by-side with lines connecting matching sequence blocks.
Launching the linear synteny view
You can launch a linear synteny view in two ways:
- From the dotplot — select a region and click Launch synteny view (as shown above).
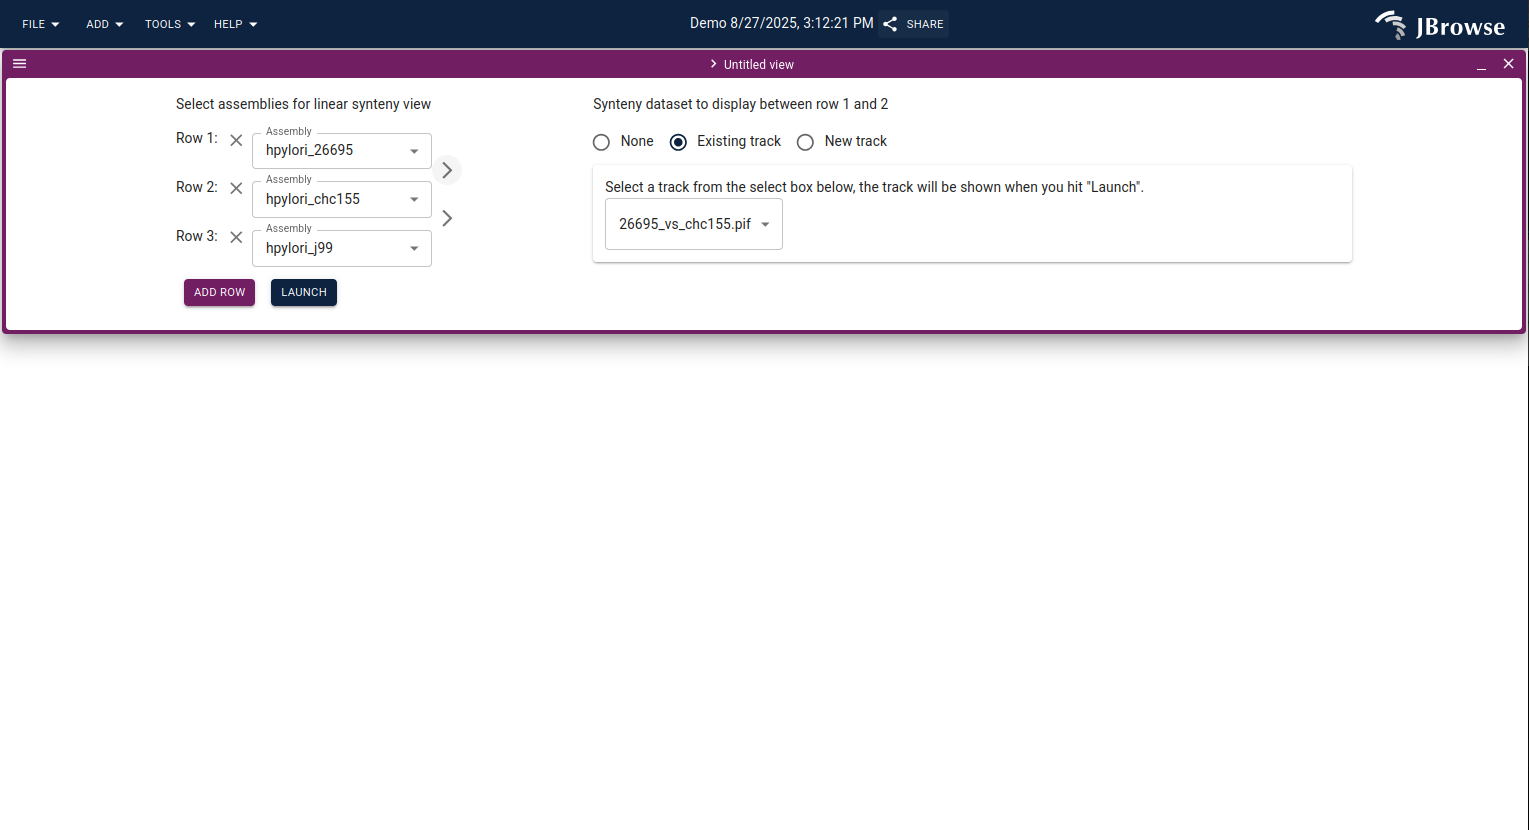
- From the start screen — click Linear synteny view, then select two assemblies and enter location ranges for each.
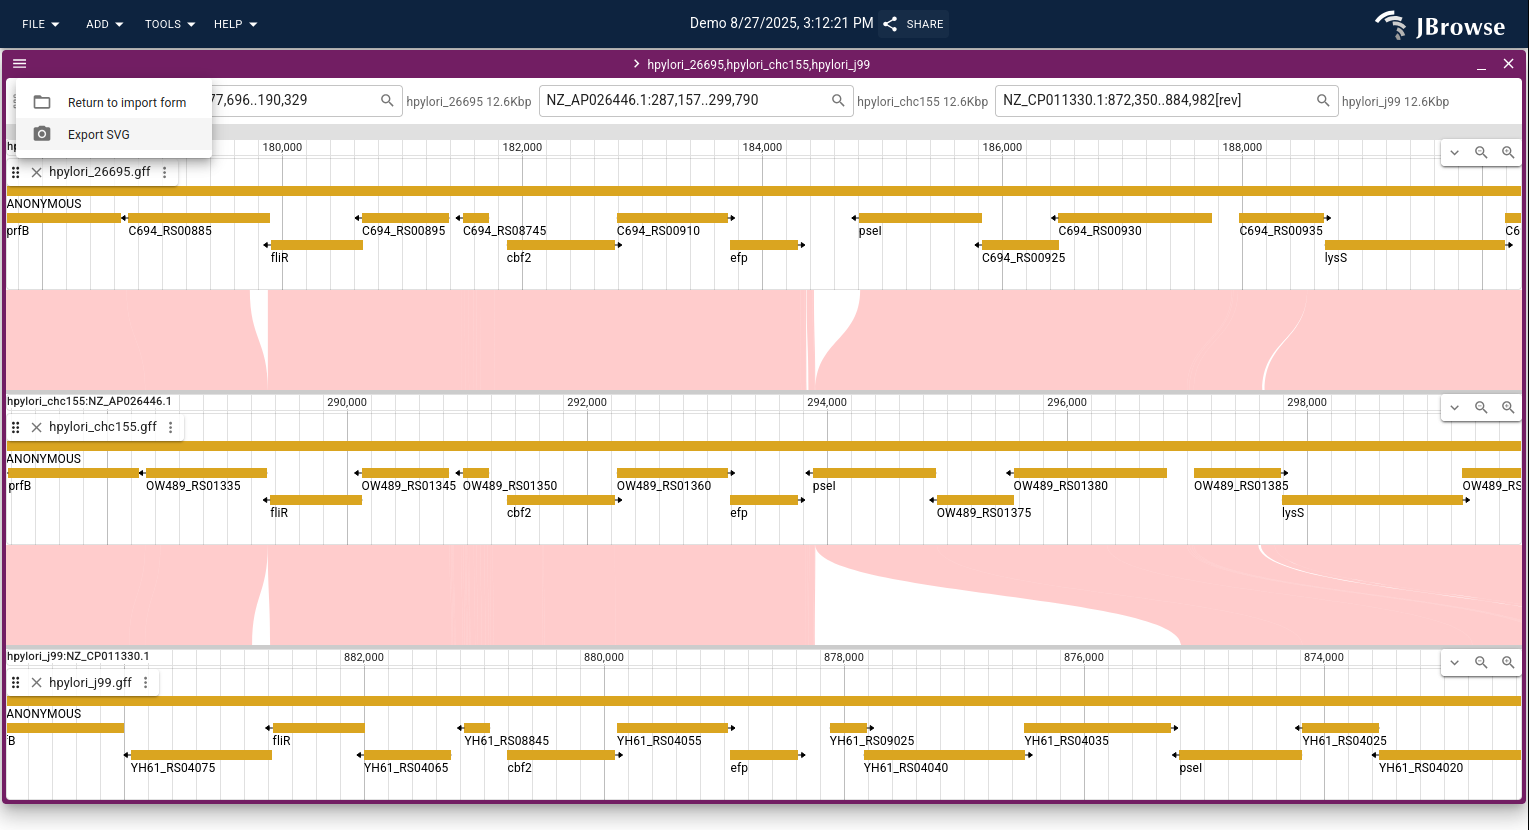
Configuring the linear synteny view
Search for genomic locations in the header bar to navigate, and open additional tracks (gene annotations, read alignments) via the track selector.
Troubleshooting
| Problem | Possible cause | Solution |
| ------------------------------------------------ | ----------------------------------------------- | ----------------------------------------------------------------------------------- |
| The dotplot or synteny view is blank | Assemblies or track names don't match | Verify assembly names match your jbrowse add-assembly and add-track -a commands |
| Lines don't appear, or appear scattered randomly | The PAF was generated with wrong parameters | Try re-running minimap2 with -x asm5 for assembly comparison |
| Alignments are reversed or flipped | The PAF was generated in the opposite direction | Try swapping the order of input genomes: minimap2 query.fa reference.fa |
Using PIF for large genomes
For large whole-genome alignments, convert your PAF to PIF (Pairwise Indexed Format) so JBrowse fetches only the alignments in the current viewport:
jbrowse make-pif alignment.paf
jbrowse add-track alignment.pif.gz -a query,reference --out $OUT --load copy
See the PIF format guide for details.
Next steps
- Overlay annotations — load gene GFF/GTF files on both sides to identify conserved genes and orthologs.
- Compare multiple organisms — load several pairwise alignments to build a phylogenetic perspective on genome evolution.
- Multiway alignment — for visualizing MAF (Multiple Alignment Format) data across more than two genomes, see jbrowse-plugin-mafviewer.
For more on working with synteny views, see the dotplot view guide and the linear synteny view guide.
References
Diesh, C., Stevens, G. J., Xie, P., et al. (2024). Setting Up the JBrowse 2 Genome Browser. Current Protocols, 4(8), e1120.
Diesh, C., Stevens, G. J., Xie, P., et al. (2023). JBrowse 2: A Modular Genome Browser with Views of Synteny and Structural Variation. Genome Biology, 24(1), 74.