JBrowse 2 visualizations gallery
Below are some examples of the visualizations JBrowse 2 has to offer. For live demos, have a look at the demos page.
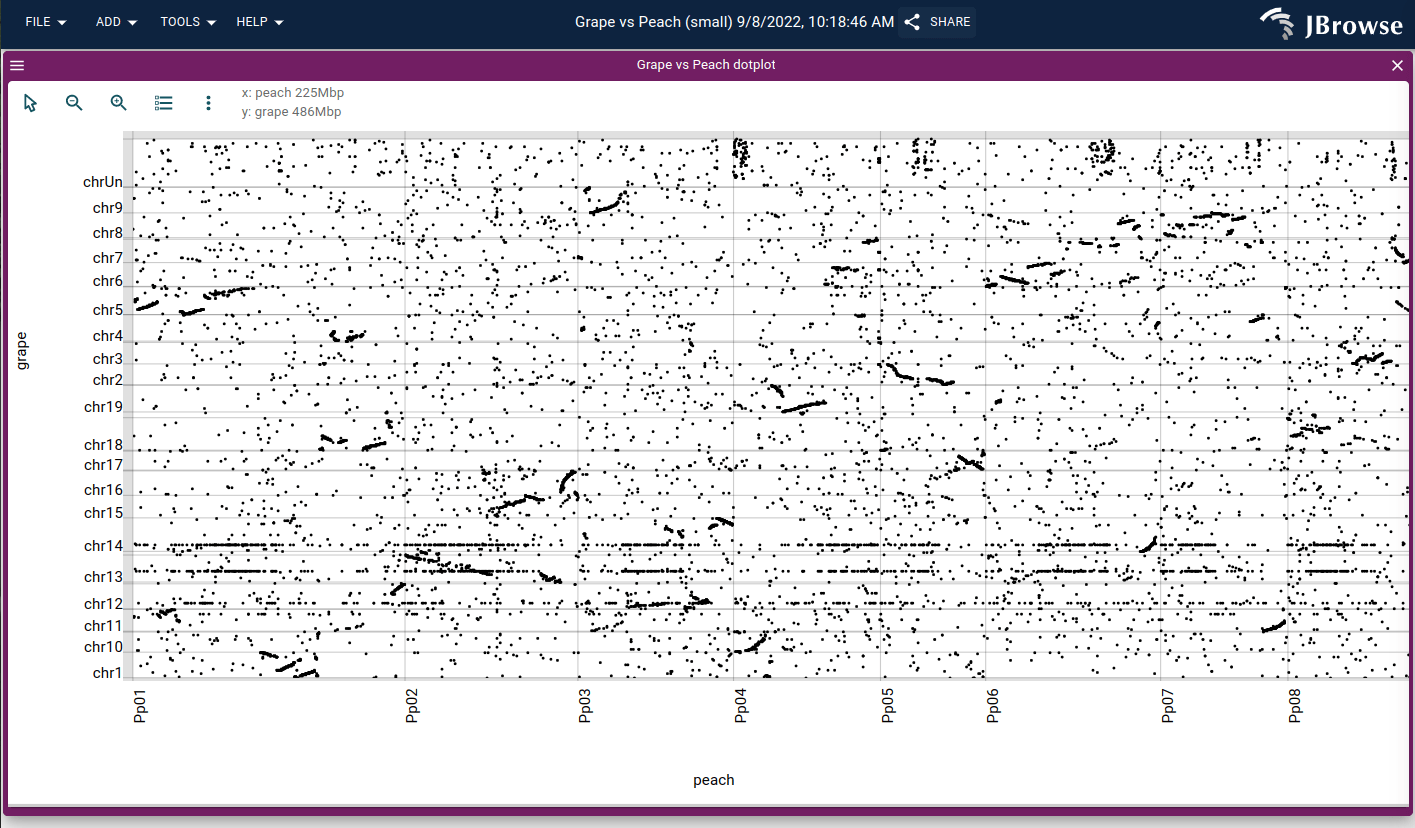
A dotplot showing the alignment between the grape vs peach genome, loaded from a PAF file generated by minimap2 (live link)
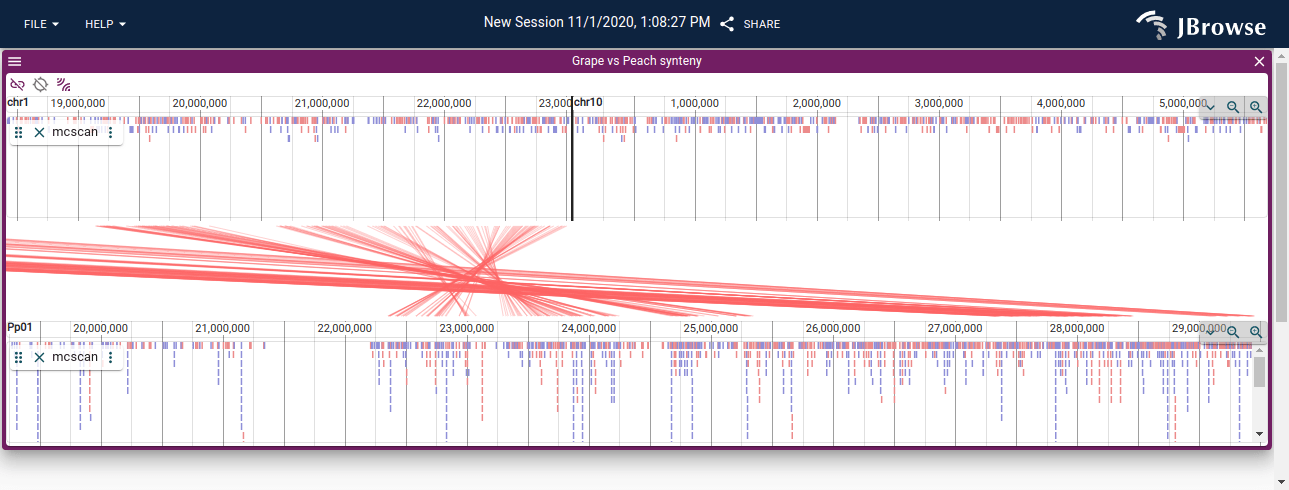
A linear synteny view of the grape vs peach genome using data from MCScan. The screenshot shows both the individual connections between aligned protein coding genes, and the larger synteny blocks. The synteny blocks are also rendered as the blue (inverted) and red (non-inverted) blocks on each linear genome view (live link)
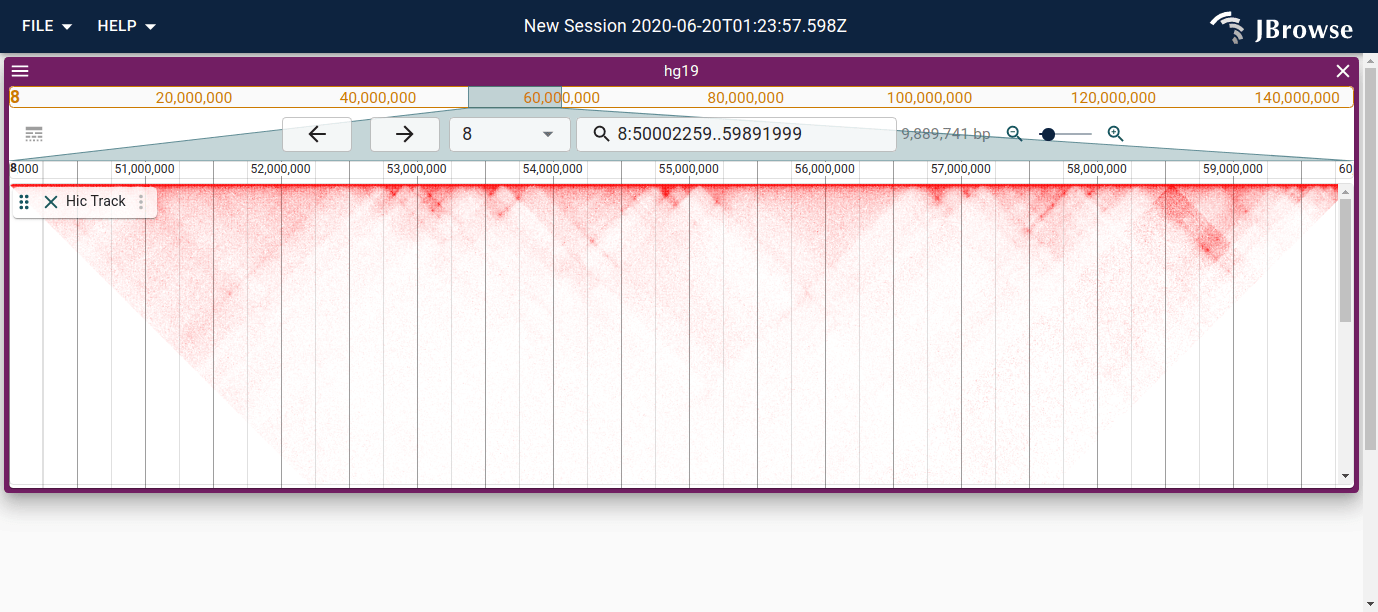
Screenshot showing a Hi-C contact matrix rendered in JBrowse using the .hic file format (from Juicebox) (live link)
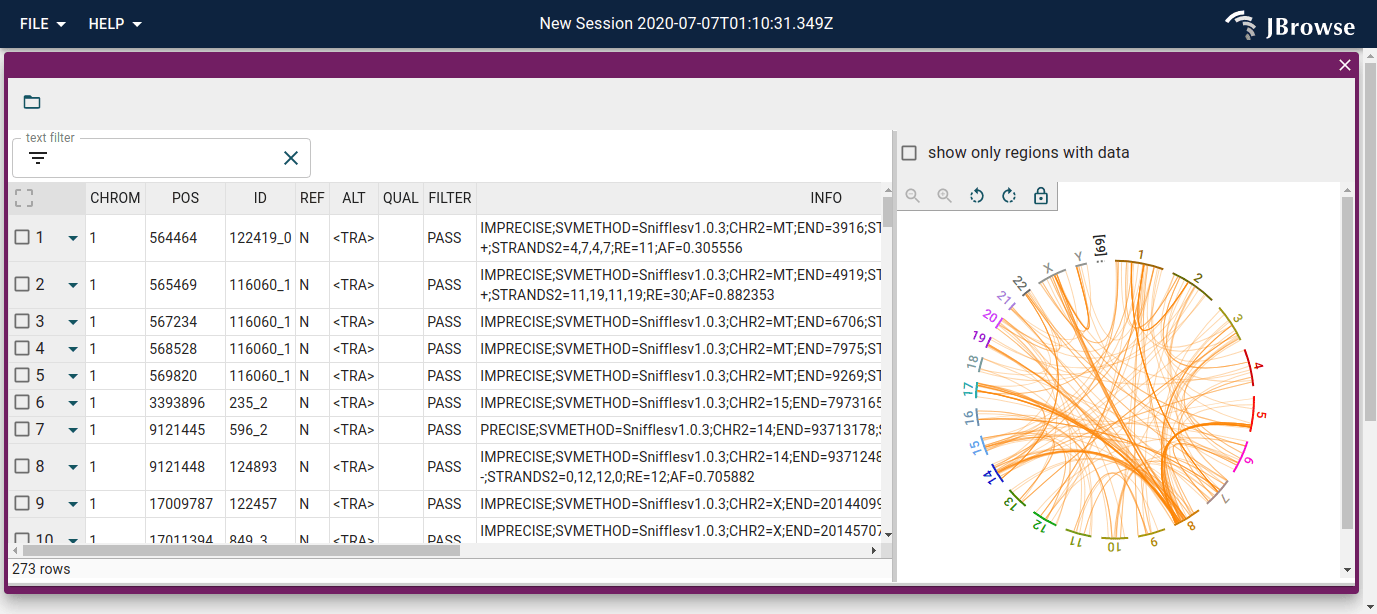
Screenshot of the SV inspector displaying inter-chromosomal translocations in the SKBR3 cell line. The SV inspector is a tabular view plus whole-genome circular overview of the SVs (live link)
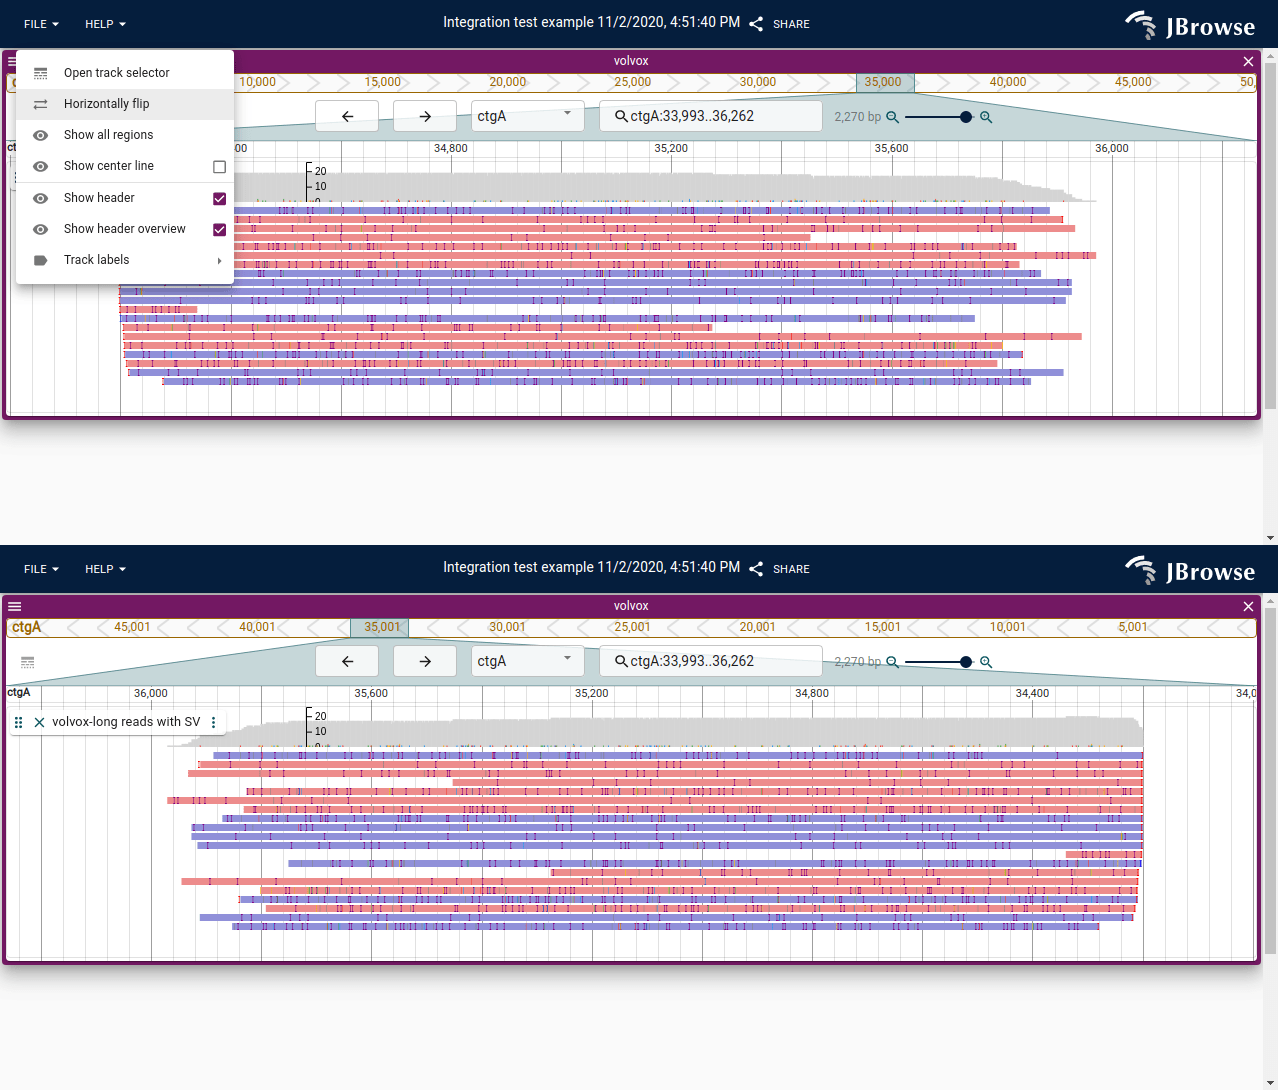
Screenshot showing the ability to “horizontally flip” the linear genome view. This feature allows the genome to be read “right to left”, or 3’ to 5’ instead of 5’ to 3’, which can help when looking at anti-sense genes or features (live link)
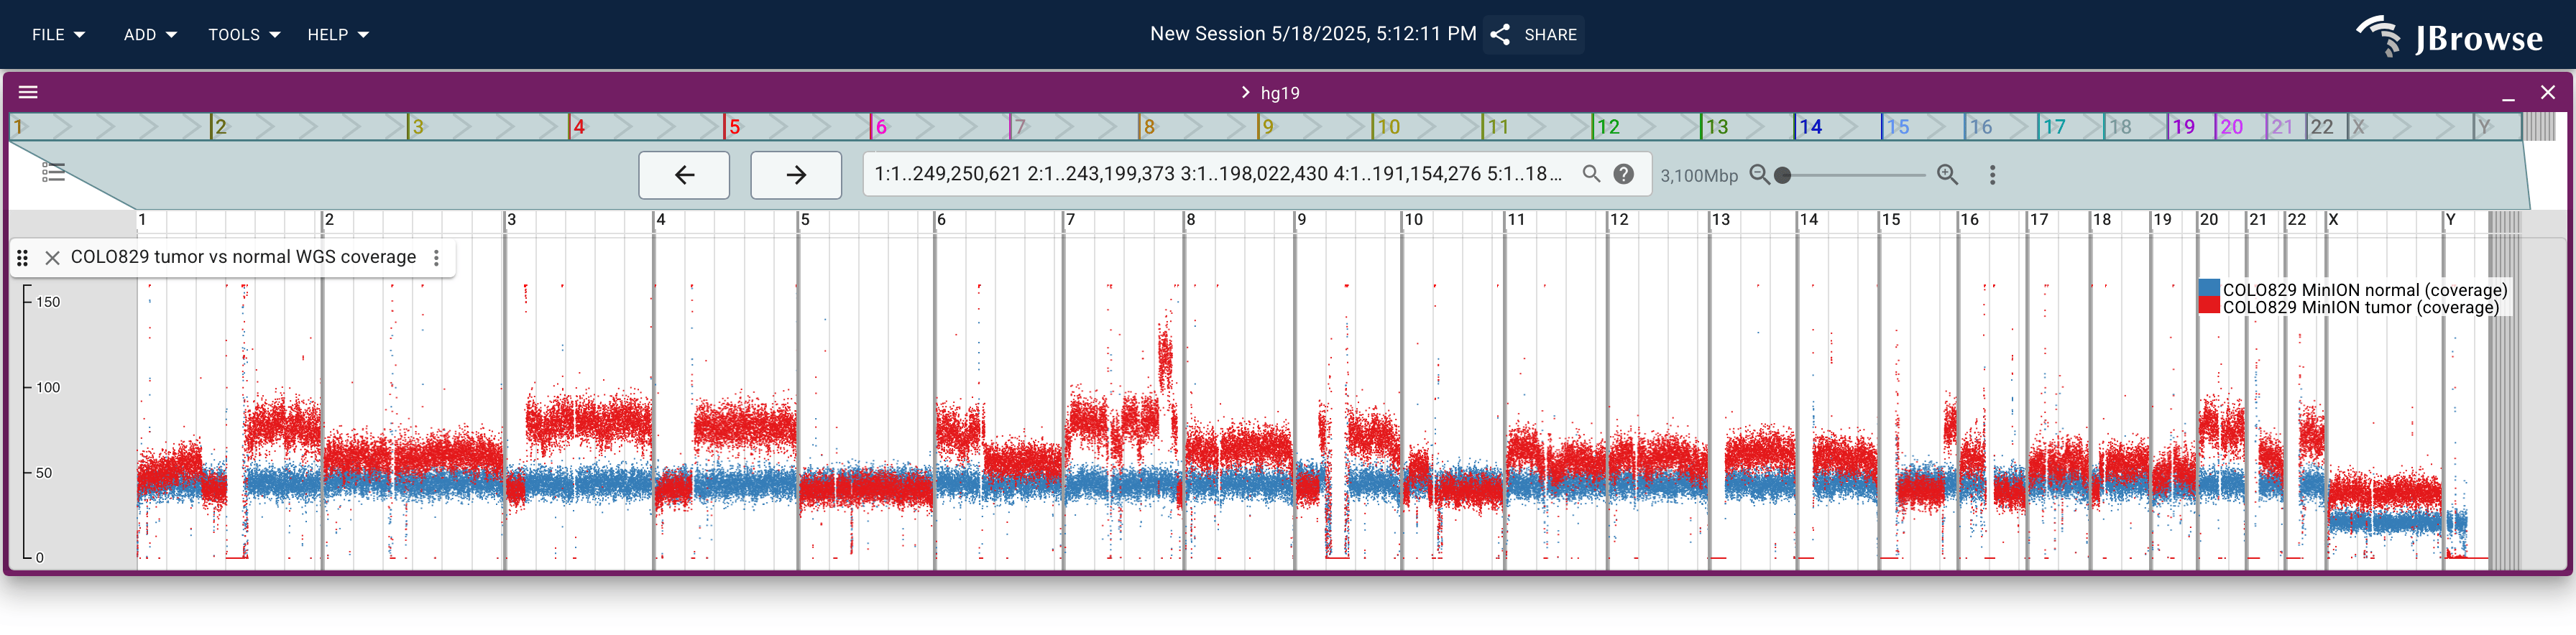
This screenshot shows whole-genome sequencing coverage from the COLO829 melanoma cancer cell line. It shows both “normal” (blue) and “tumor” (red) sequencing coverage on the same track (a “multi-quantitative” track). The sequencing coverage is computed from mosdepth and stored in BigWig files (live link)
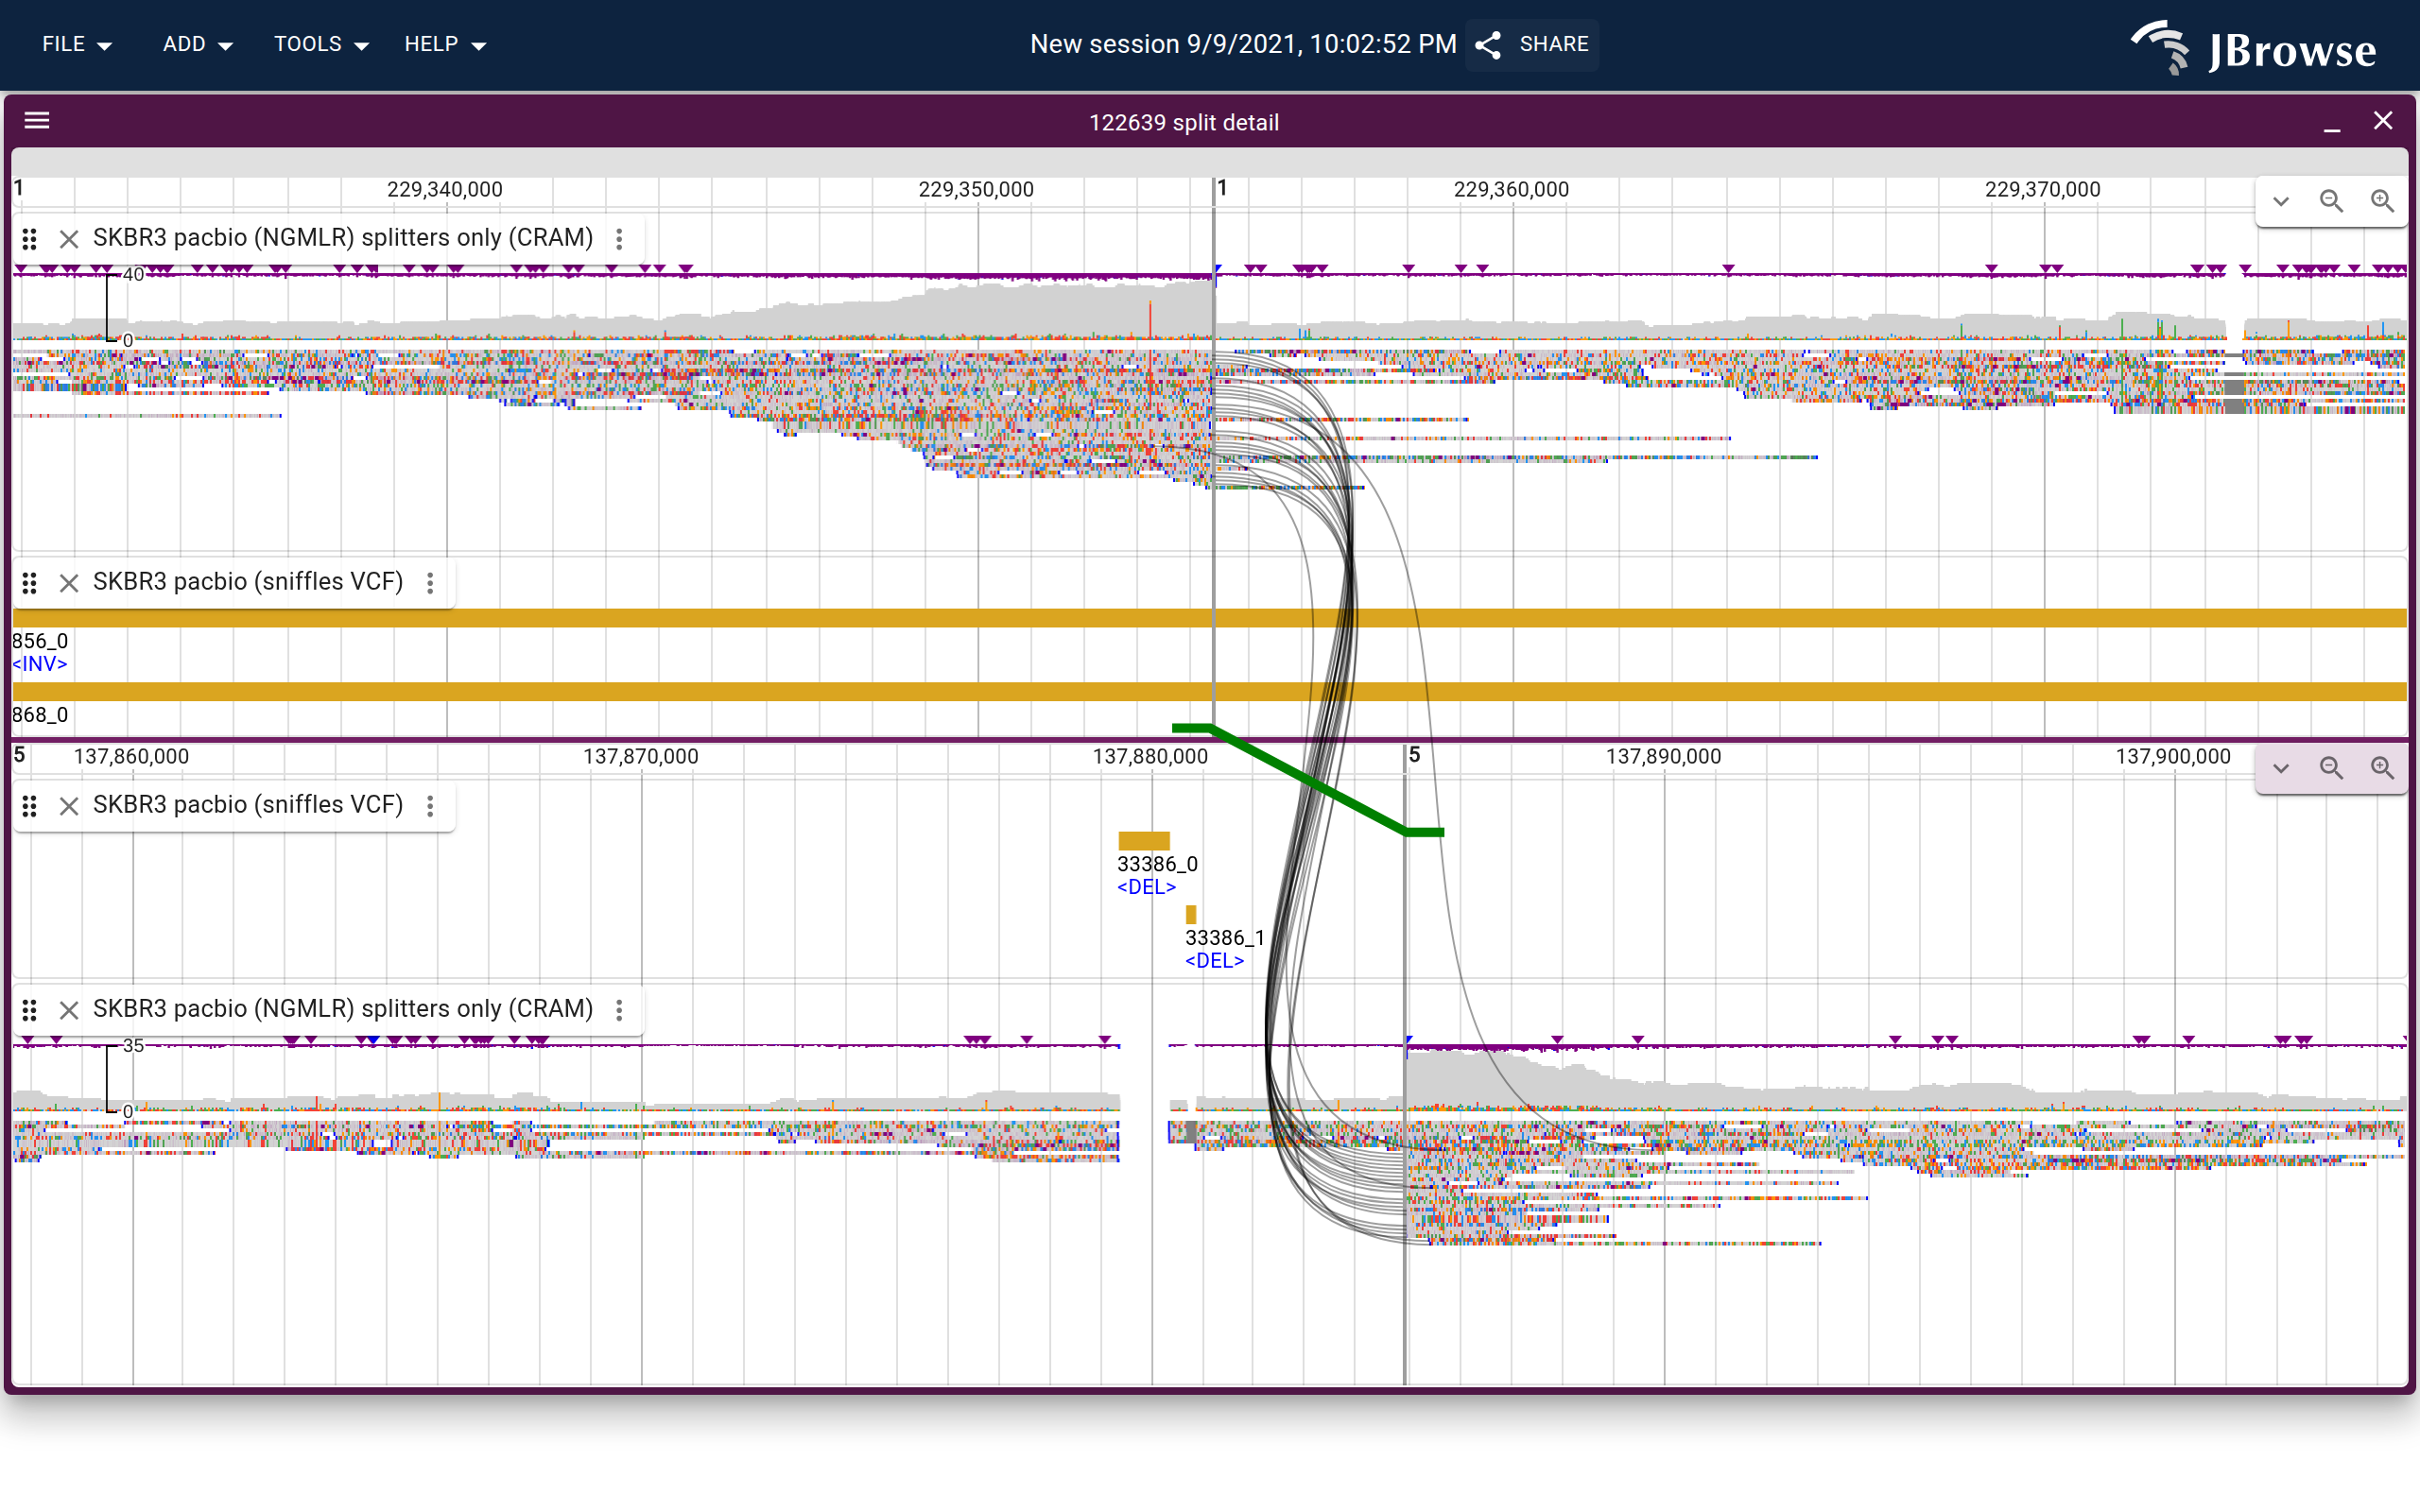
Image of a possible translocation in the SKBR3 dataset using the “breakpoint split view” which can connect supporting reads (black curves) and the variant call itself (green thicker line, with feet indicating directionality) (live link)
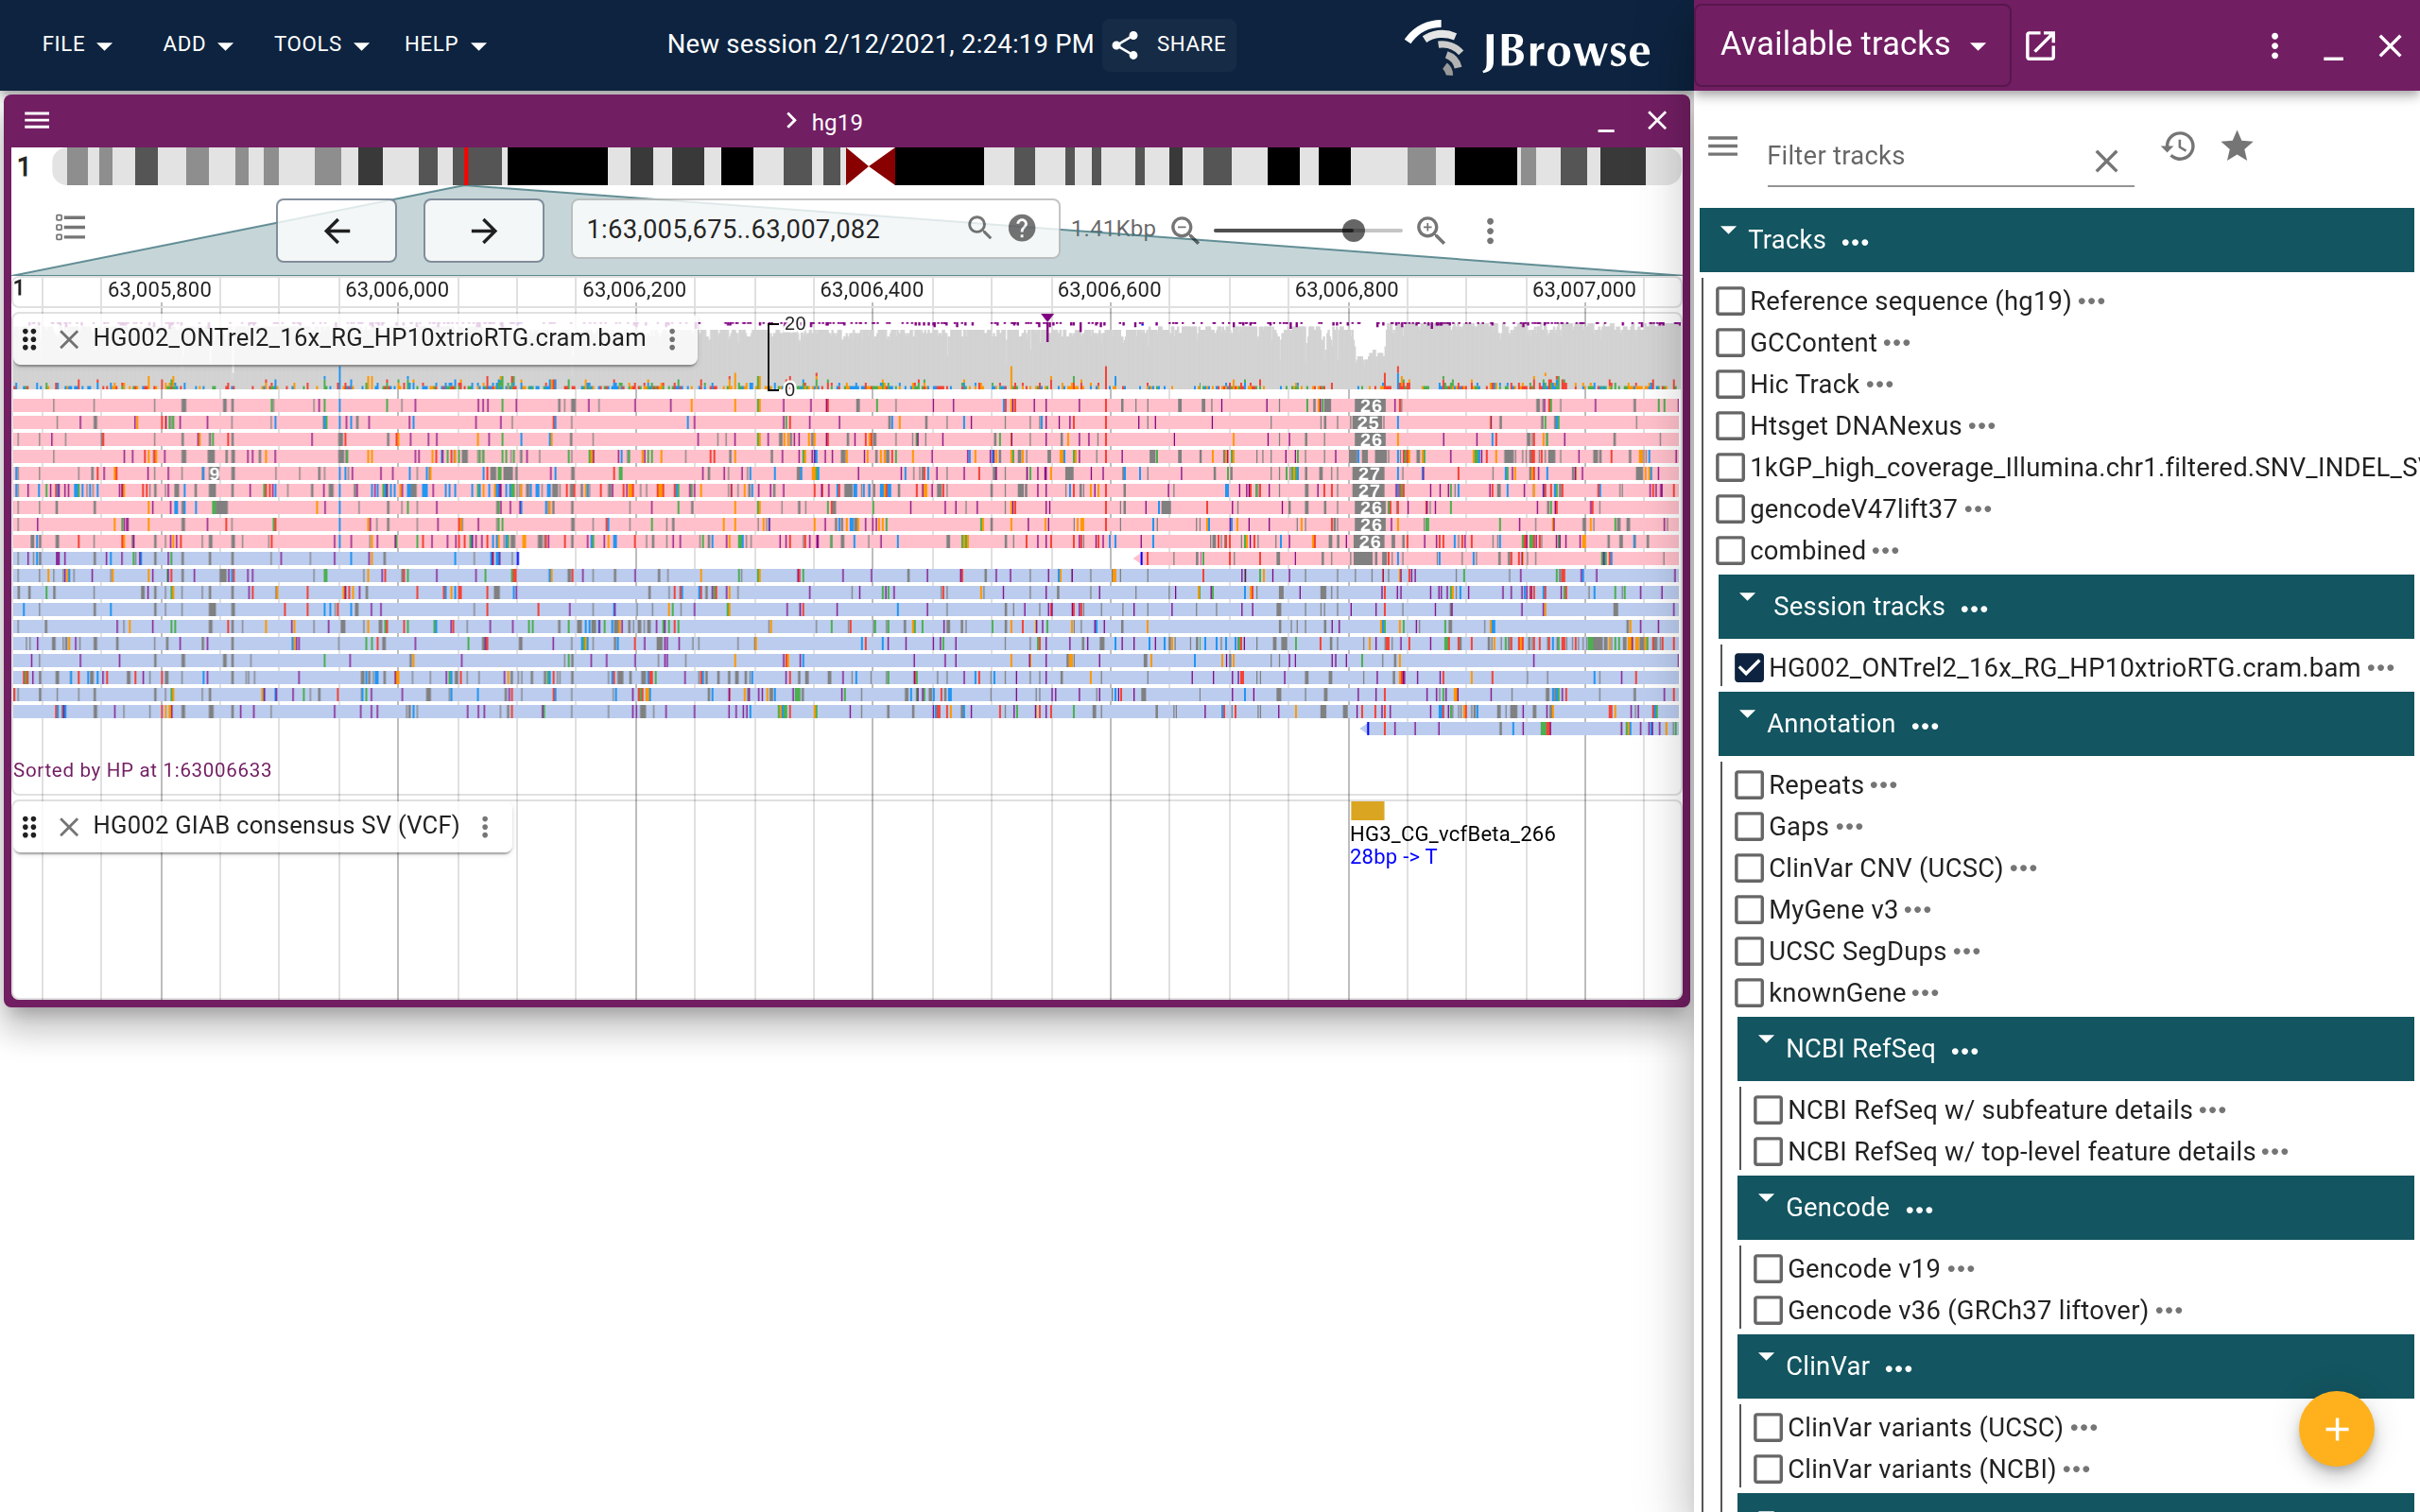
Screenshot showing a heterozygous small deletion in the GIAB dataset. The nanopore reads are colored and sorted by the HP (haplotype) tag which helps show that the deletion is exclusive to one haplotype. Users can color, sort, group, and filter by tags (live link)
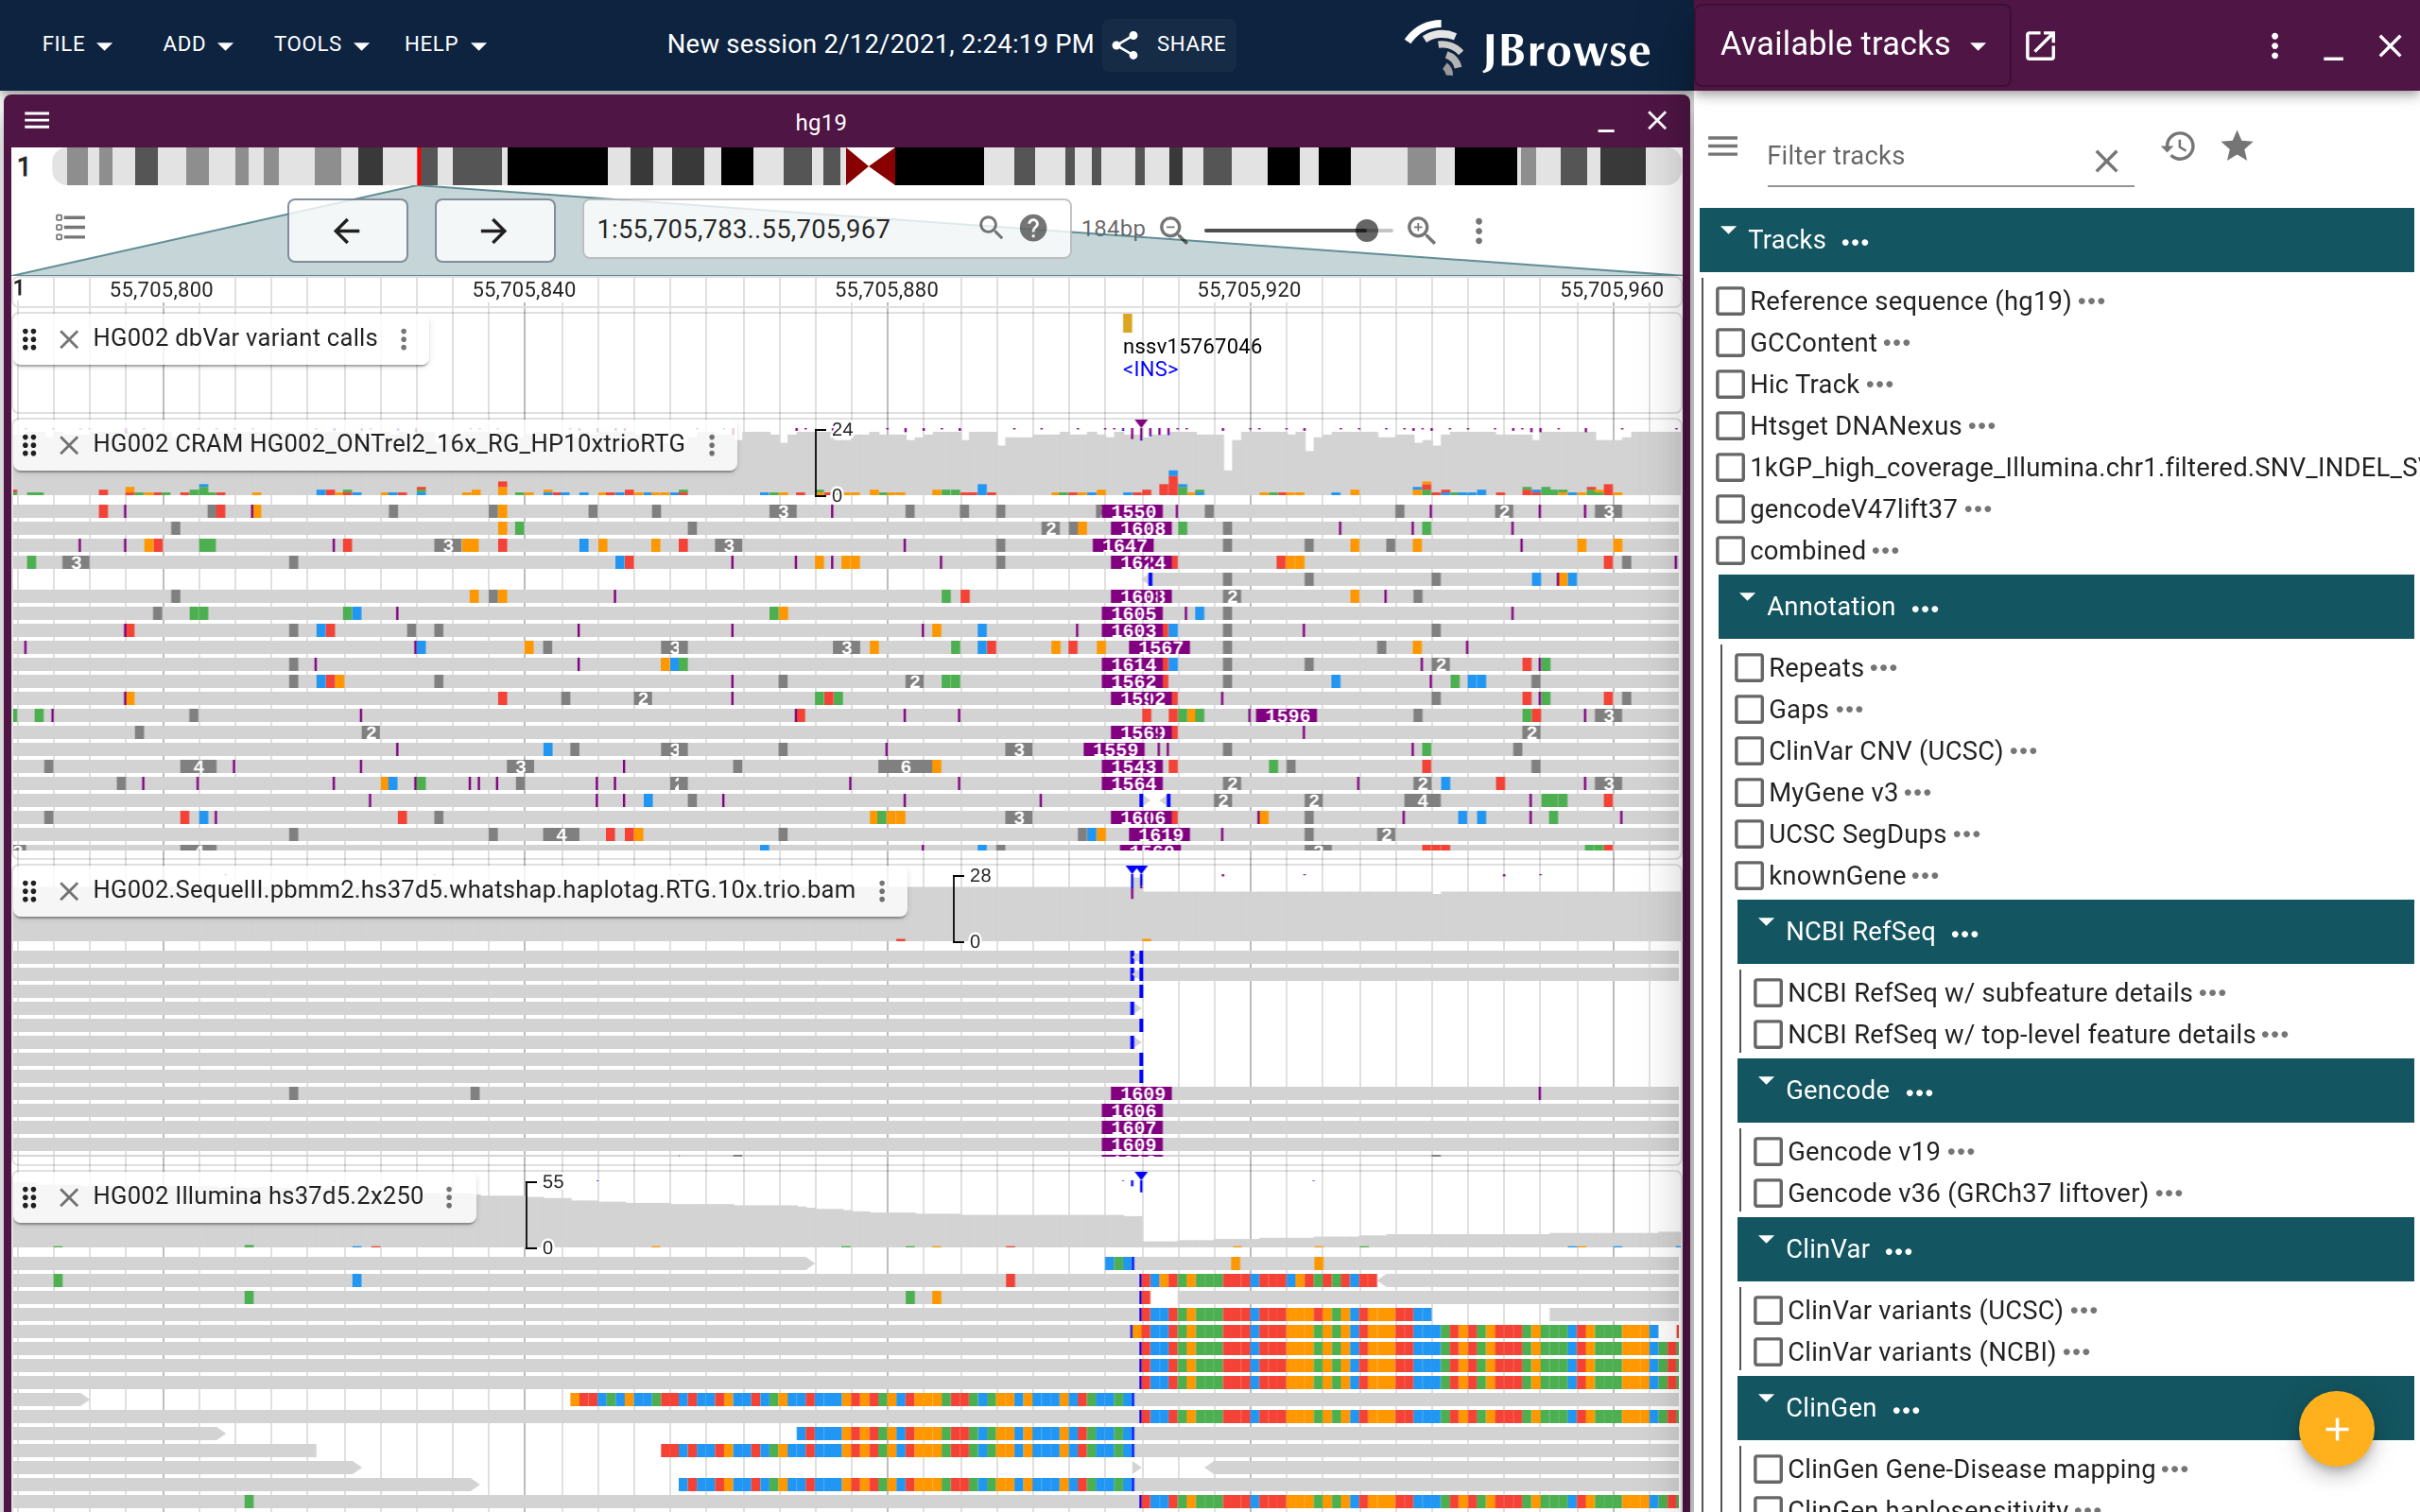
Screenshot showing a ~1.5kb insertion in the GIAB dataset, with Nanopore, PacBio, and Illumina reads. This screenshot shows the “Show soft clipping” option enabled on the Illumina reads, which helps reveal the boundaries of the insertion on the short reads, while the long reads fully span the insertion (live link)
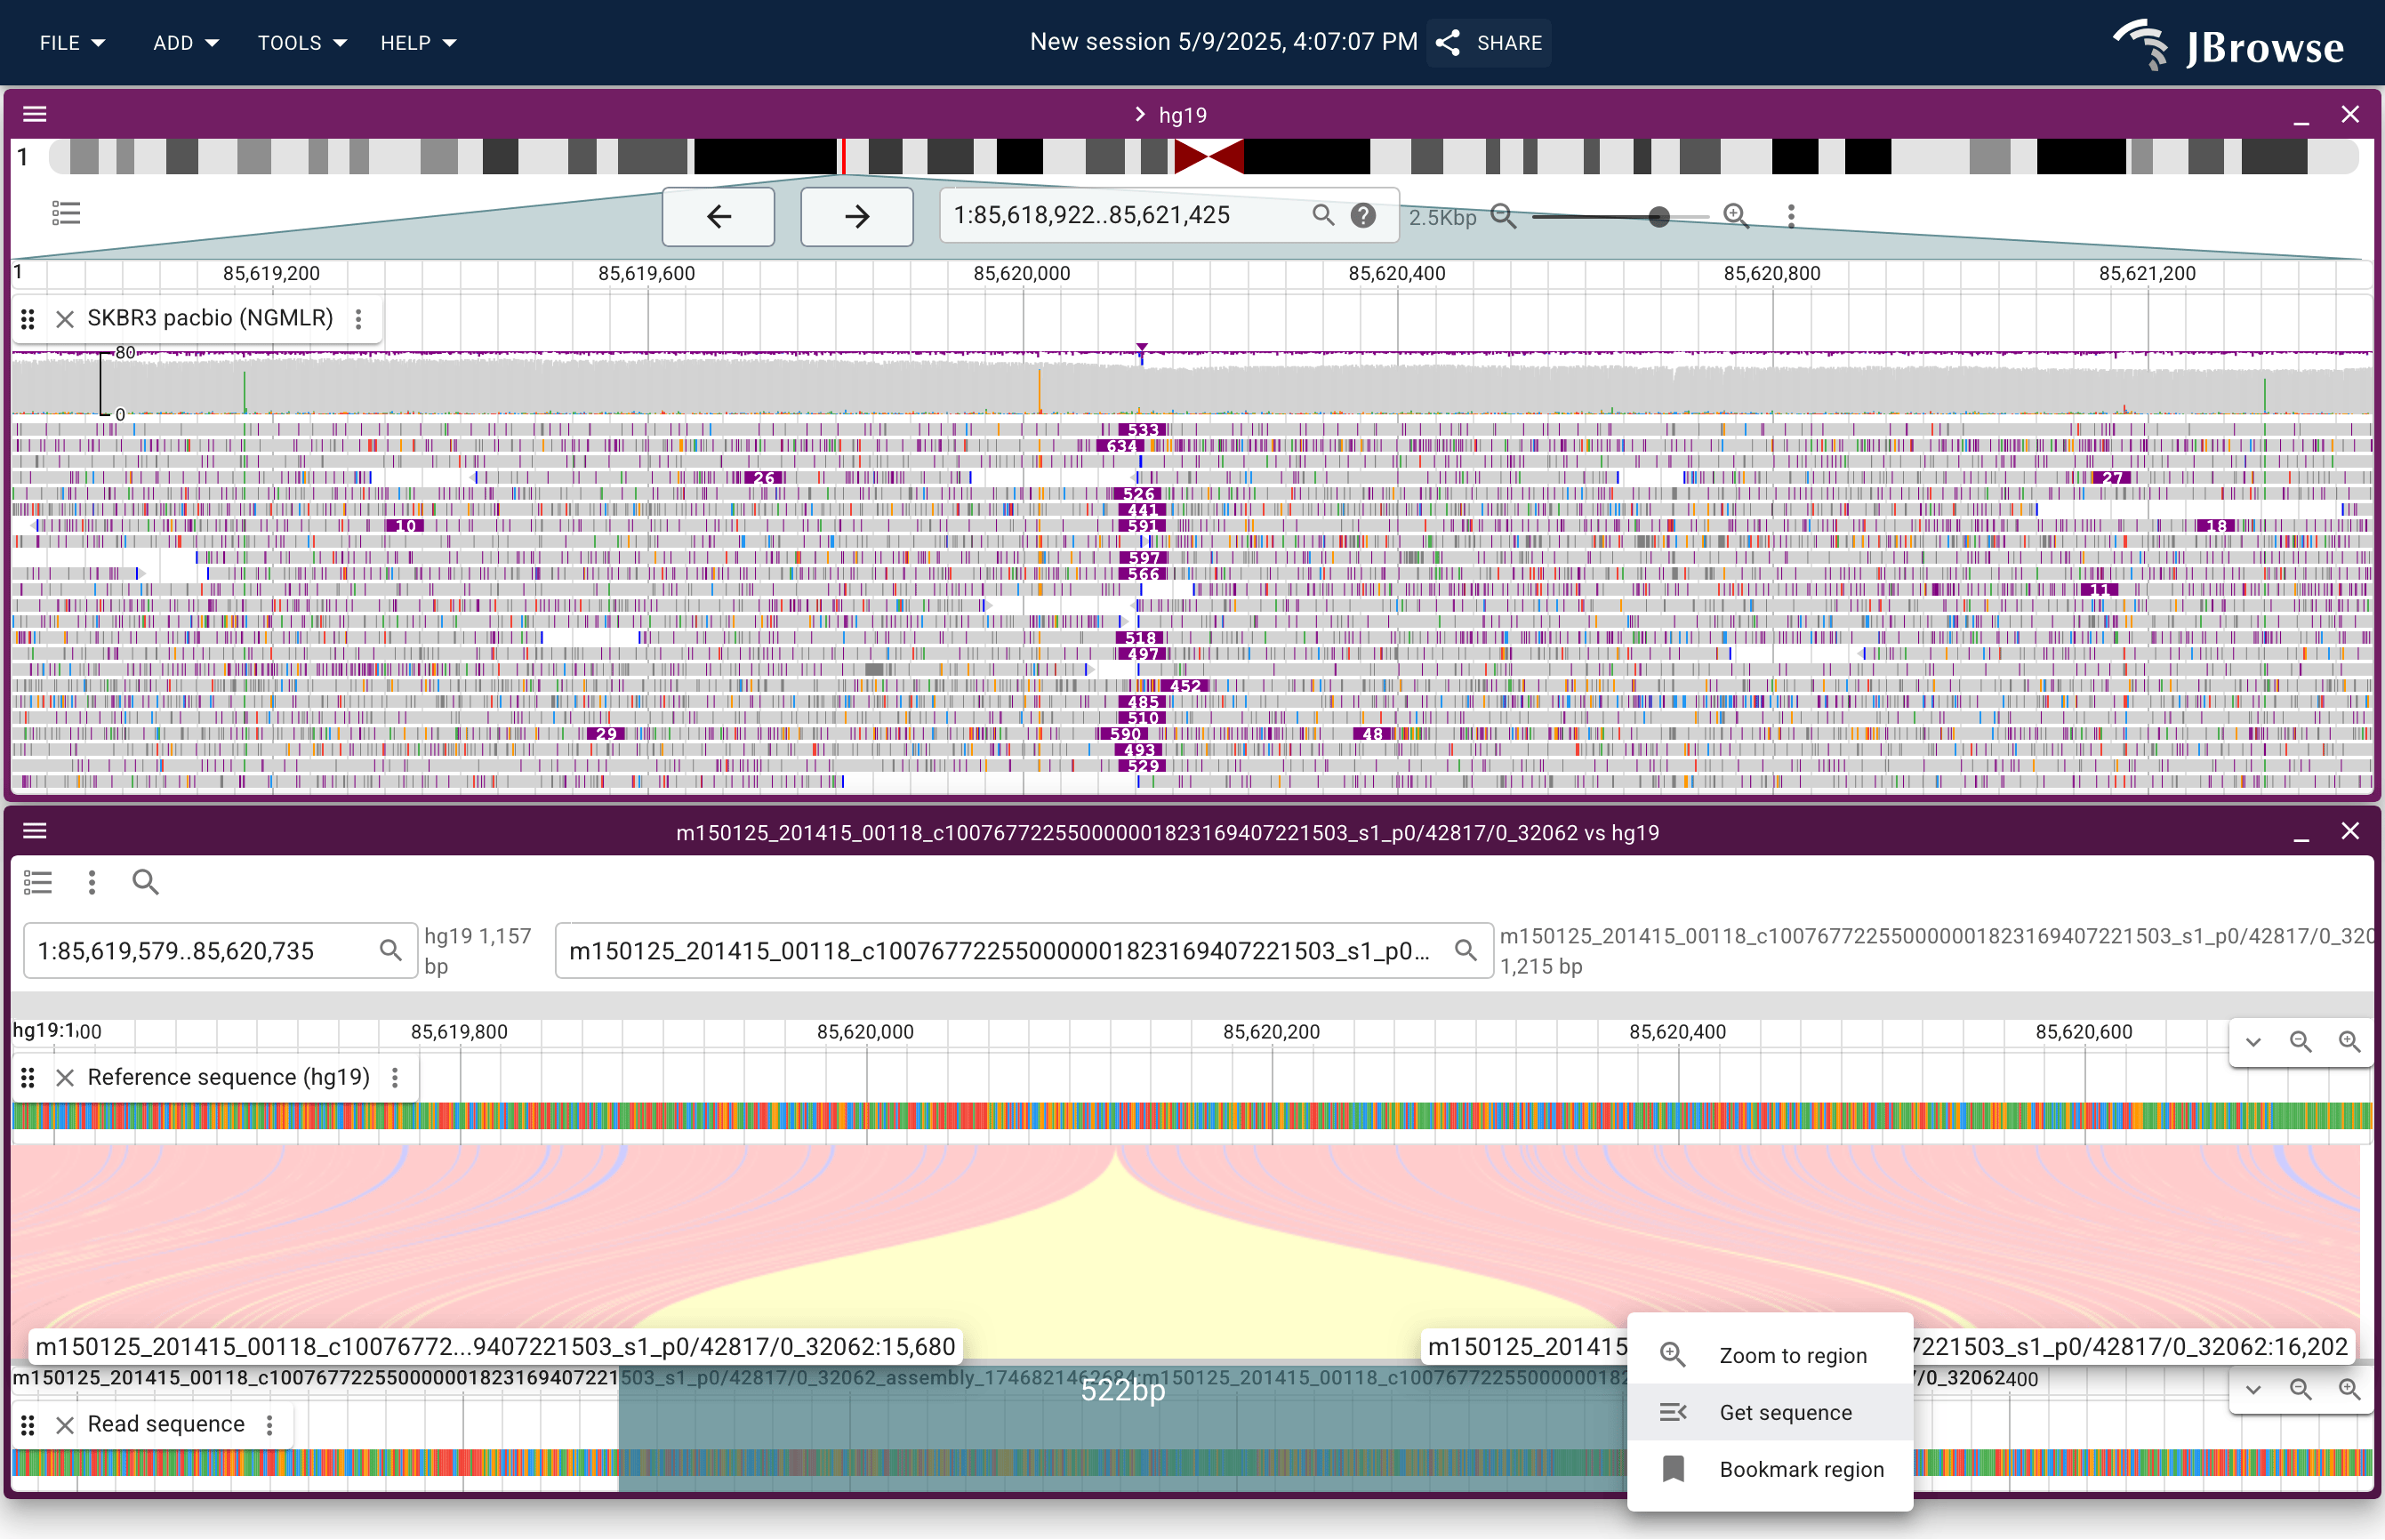
Screenshot showing a ~500bp insertion from SKBR3 (breast cancer) cell line PacBio reads. Users can right-click sequence reads, then click “read vs reference” to show complex read alignments in a “synteny style” view (lower panel). Users can also interactively get the sequence of read portions with a click-and-drag action (lower panel, in blue) (live link)
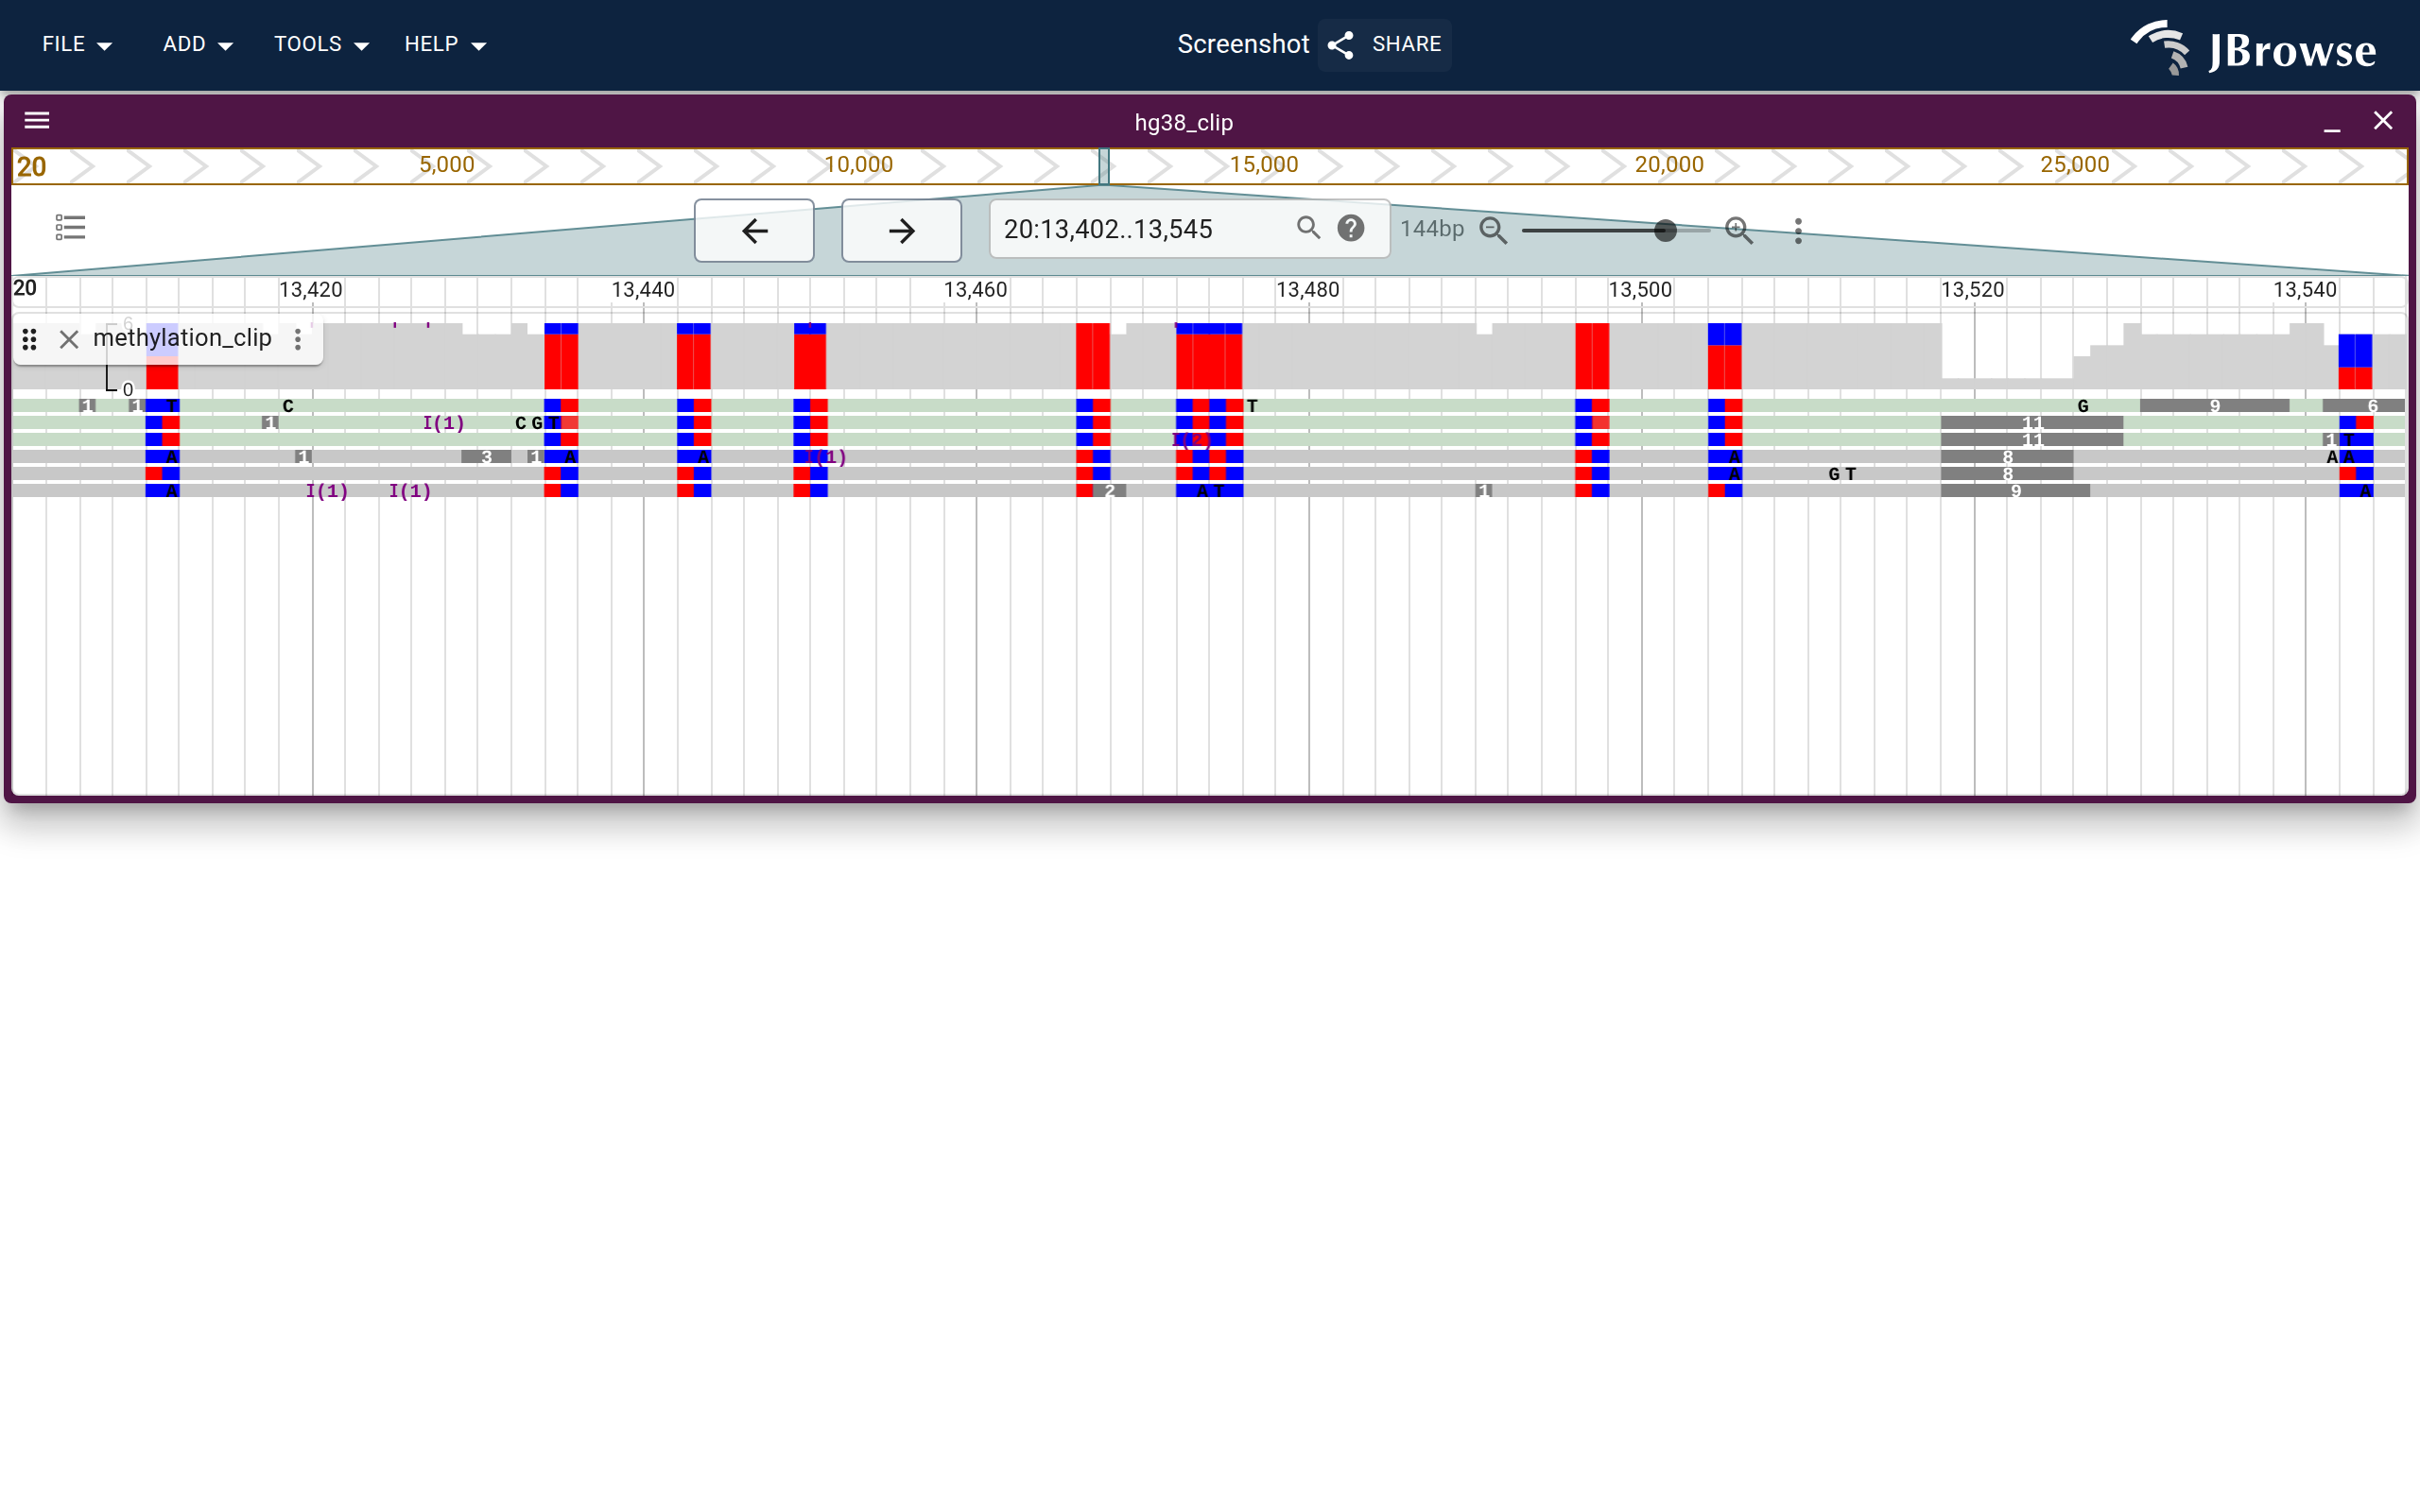
A methylated and unmethylated CpG island shown using the MM tag with nanopore reads on the COLO829 (melanoma) cancer cell line. (live link)
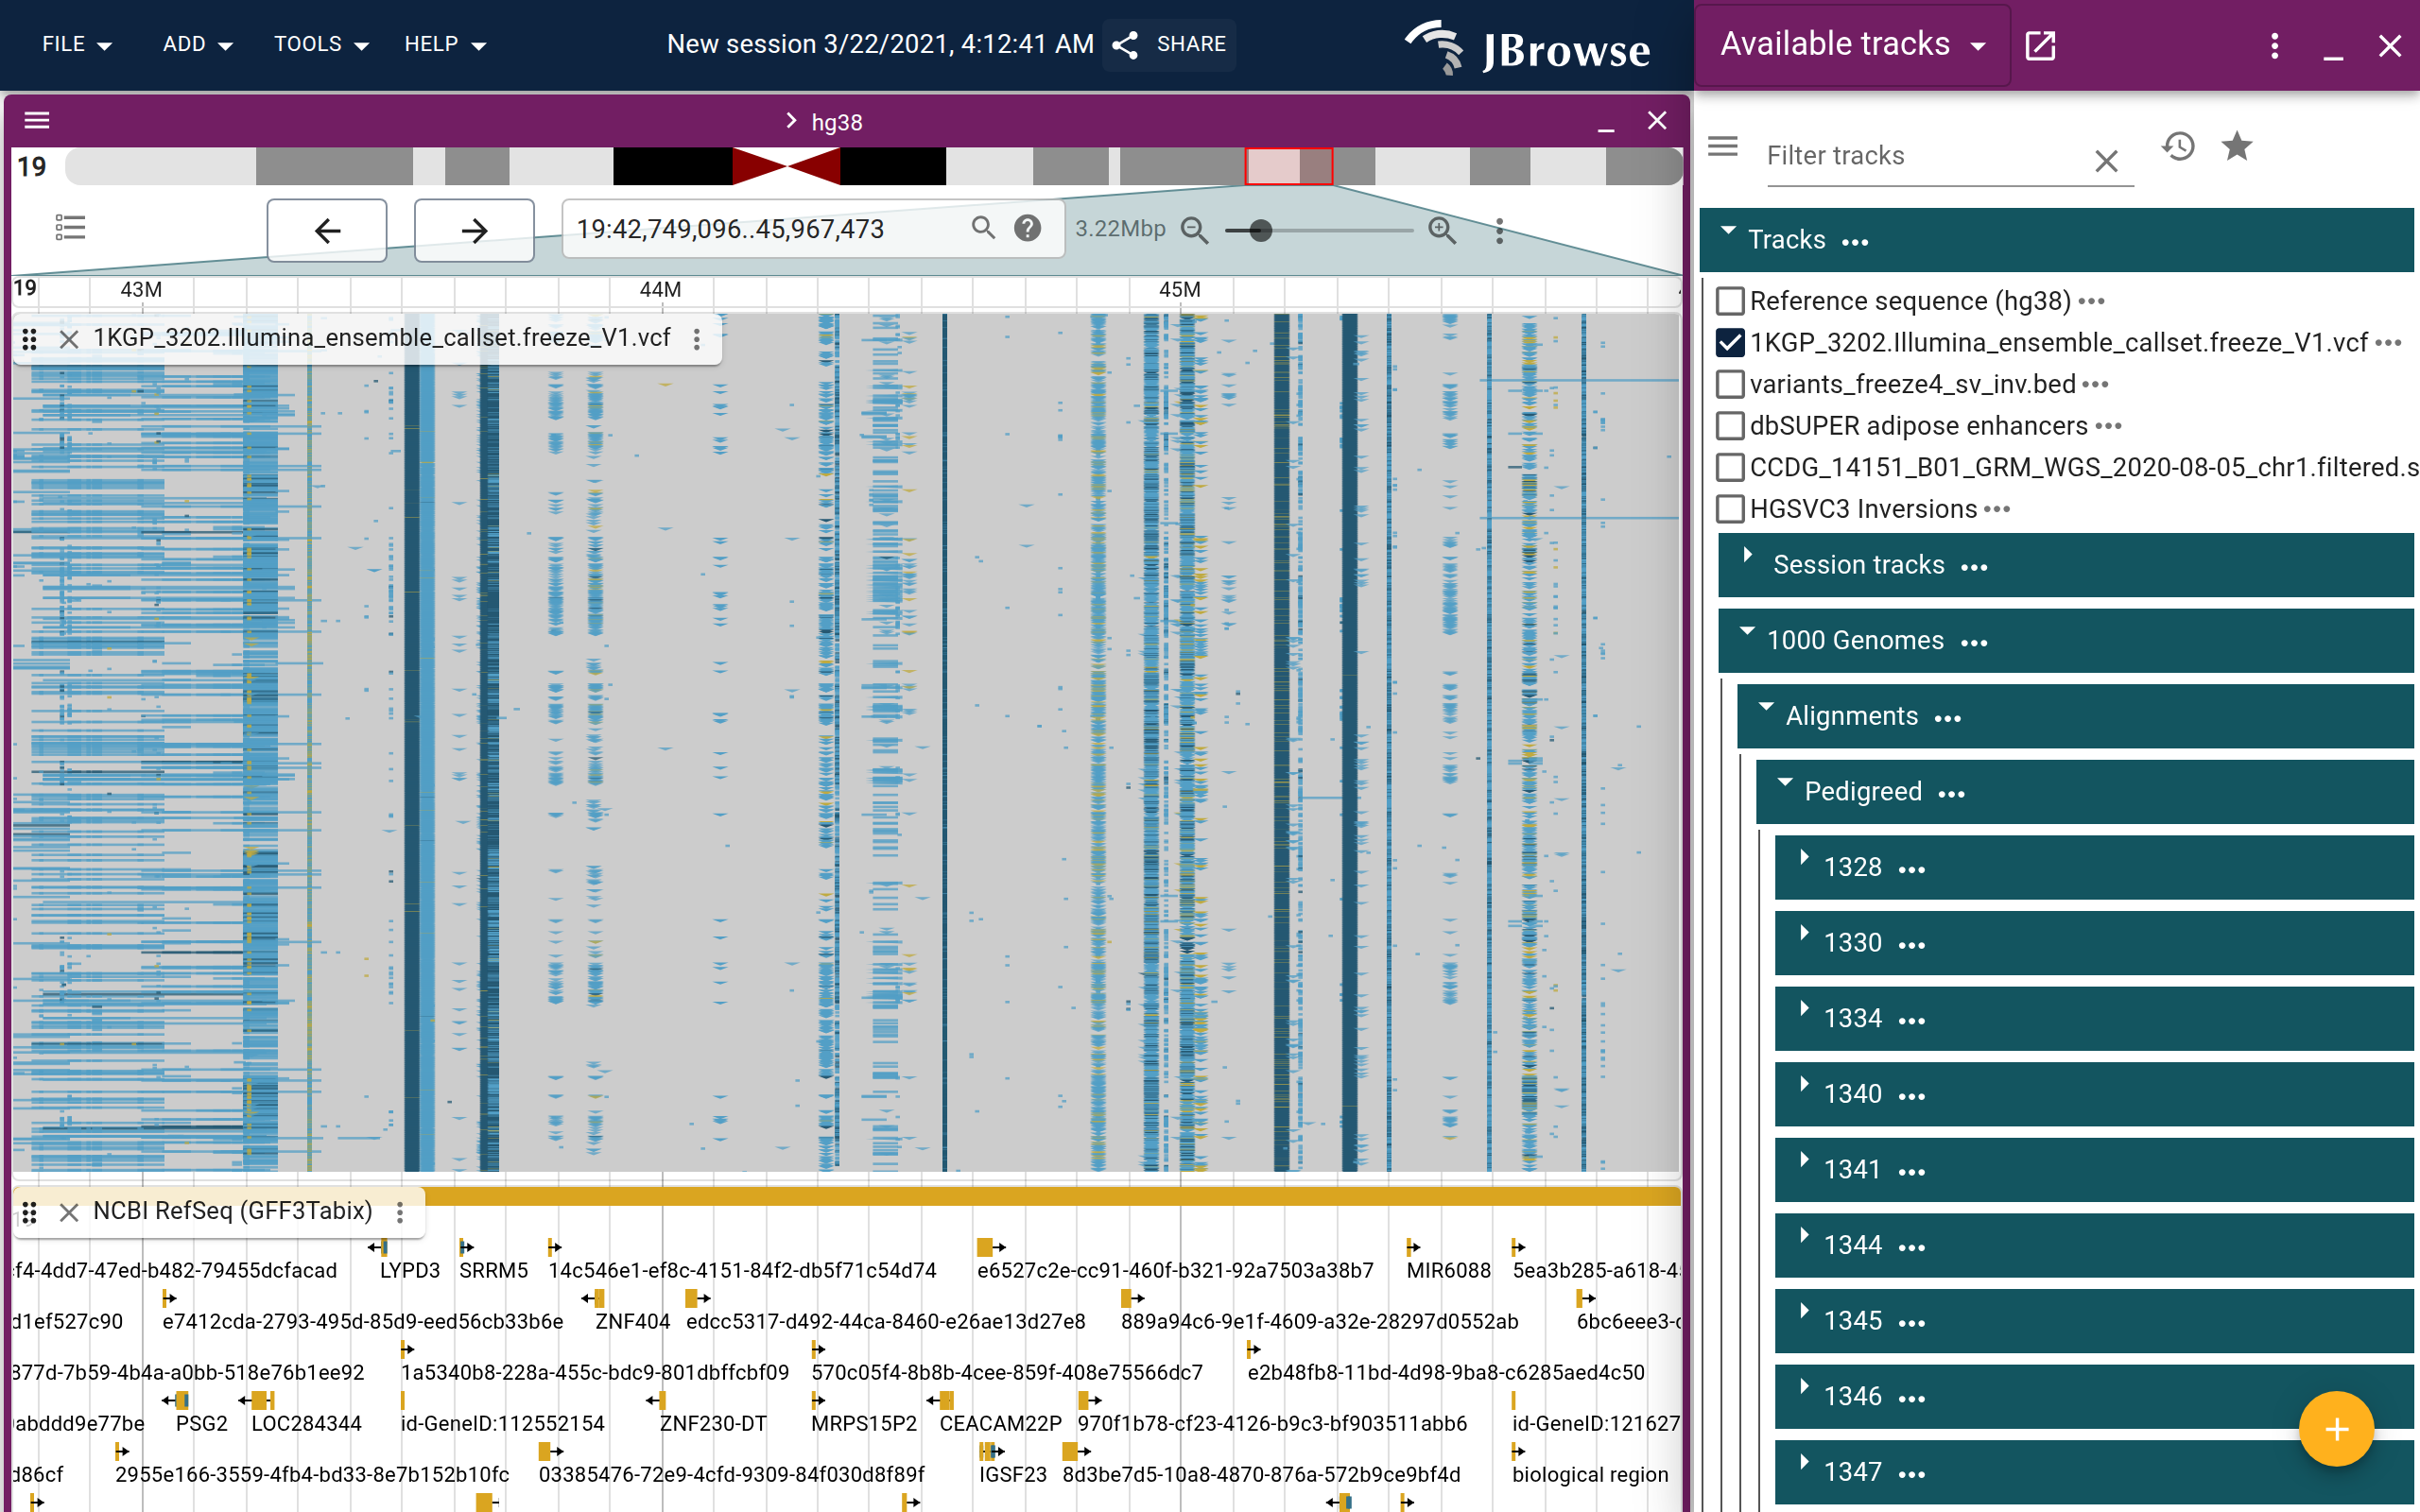
An example of the 1000 genomes structural variant call VCF, showing a large inversion on chromosome 19. This screenshot used the in-app clustering workflow on the inverted region, and then zoomed out further (live link)